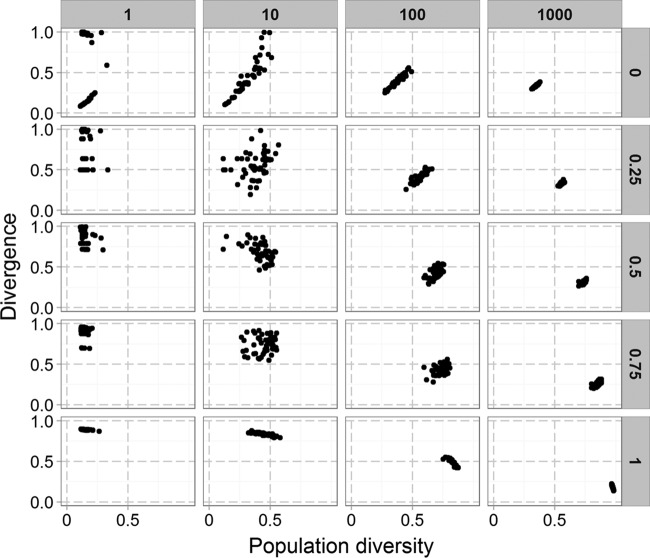
FIG 5 .
The impact of bottlenecks depends on the initial population structure. Each point represents a single run of the simulation that was run 50 times for each combination of initial population diversity and bottleneck size. Other parameters were as set in Fig. 1. Bottleneck size is shown at the top, increasing from left to right, while initial population diversity is shown on the right, increasing from top to bottom.

