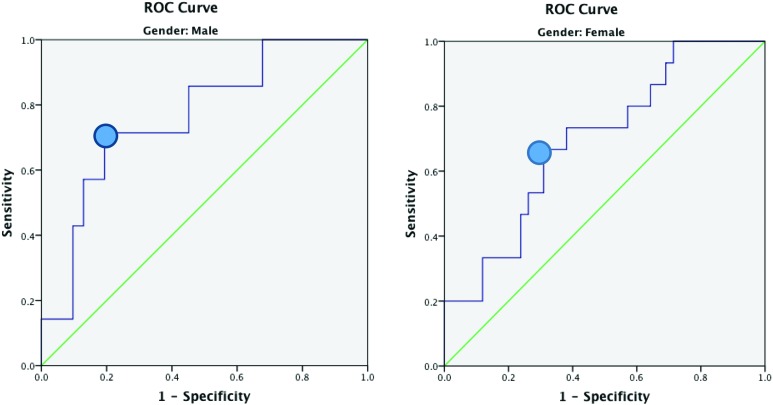
Figure 1.
Receiver-operator characteristic (ROC) curves for FPT composite scores in males and females. The green line represents the line of no-discrimination. The diagonal divides the ROC space. Points above the diagonal represent good classification results (better than random), points below the line represent poor results (worse than random). Blue dots represent points that maximize sensitivity and specificity on the ROC curve (FPT composite score ≤ 20).

