. 2017 Feb 10;8(4):3062–3069. doi: 10.1039/c6sc05234g

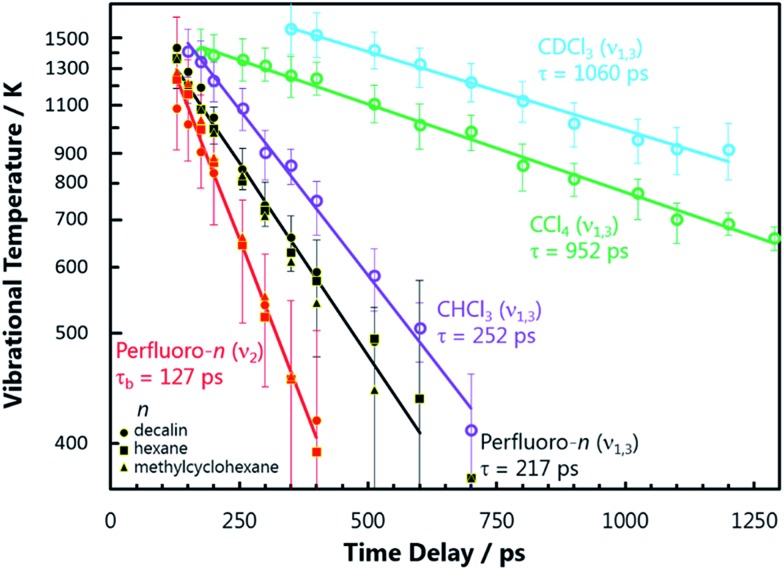
Fig. 3. The NO2 vibrational temperature (T vib), extracted from modelling the transient vibrational spectra as a function of pump–probe delay time, plotted using a ln(T vib – 293) scale. The slopes of the best-fit lines yield the vibrational temperature relaxation rate coefficients of the modes in parentheses for the indicated solvents. The time constants τ are reciprocals of these rate coefficients. NO2 vibrational temperatures obtained in each PFC solvent are represented by different symbols, but show the same behaviour and thus are fit with a single line. Only spectra with Δt > 150 ps were used for this analysis, when the vibrational populations have thermalized sufficiently to be well-described by a Boltzmann distribution of states. The error bars represent the range of T vib that result in a residual sum of squares between the experimental and model spectrum less than double the best-fit minimum value.

Fig. 3