. 2017 Feb 10;8(4):3062–3069. doi: 10.1039/c6sc05234g

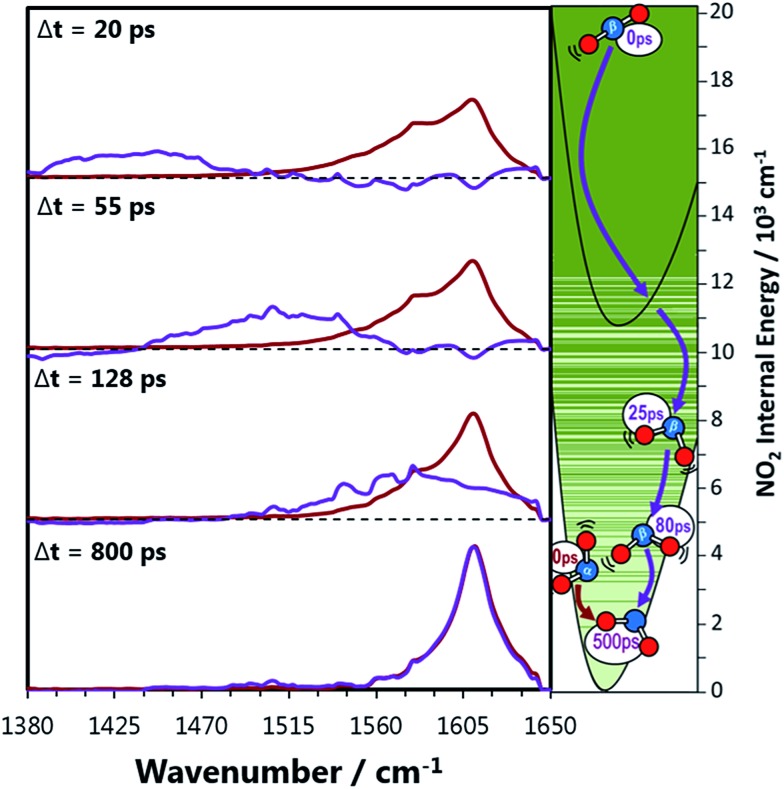
Fig. 4. Decomposed transient vibrational spectra of the two NO2 product fragments in perfluorohexane. The red lines represent NOα2 which is produced immediately with a thermal population of vibrational states described by a 1350 K Boltzmann distribution. The vibrational populations are simulated to evolve exponentially in time with the relaxation time constants obtained from Fig. 3. The difference between the experimental transient spectra and this simulation are shown as the purple lines, which represent the signal contribution from the NOβ2 fragments. The right hand panel represents the two NO2 fragments relaxing to the ground state where the solid green lines are vibrational energy levels of NO2. These lines demonstrate how the vibrational levels of NO2 become a near continuum above the A state minimum.

Fig. 4