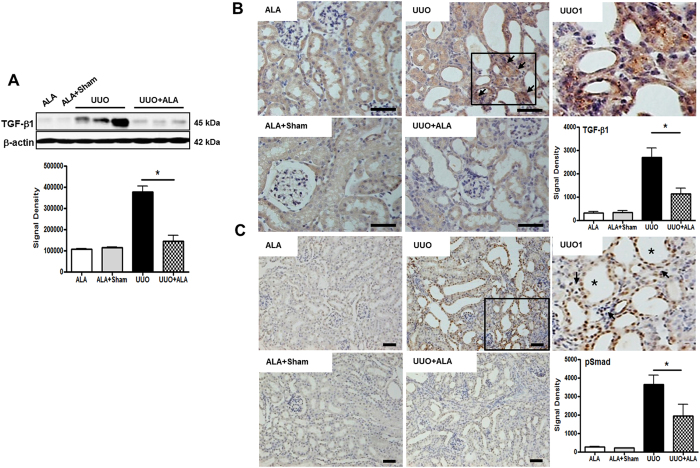
Figure 4. ALA ameliorates expression of TGF-β1 and pSmad.
Immunoblot analysis was performed with a specific antibody against TGF-β1 (A). β-actin was used as loading control and data were normalized against the density of β-action by TotalLab TL100 v2006 software. Immunohistochemical staining was performed with a specific antibody against TGF-β1 (B) and pSmad (C). The TGF-β1 expression was predominantly in the interstitium of UUO kidneys (arrow). Densitometric quantification for TGF-β1 and pSmad was applied to each group. Scale bar; 50 μm. ALA; only ALA treated group, ALA + Sham; ALA treated and no ureteral ligated group, UUO; no ALA treated, but ureteral ligated group, UUO + ALA; ALA treated and ureteral ligated group. Values are expressed as means ± SE (*P < 0.05). UUO1, enlarged image from insert in UUO. Arrow, tubular interstitial area. Asterisk, the dilated tubules.

