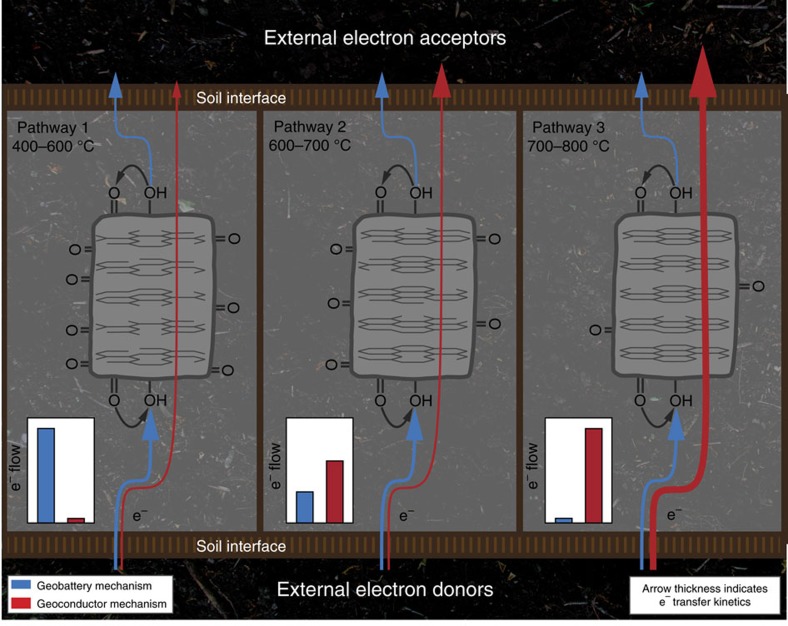
Figure 5. Schematic diagram of the pyrogenic carbon internal pathways for electron flows.
Blue arrows indicate the charging and discharging cycles of the geobattery mechanism; red arrows indicate the direct electron transfer through the geoconductor mechanism. Arrow thickness represents the magnitude of transfer kinetics. The dominating electron flow is illustrated in the inset chart for each pathway. The ordering of carbon structures determining the pathways 1, 2 and 3 are based on the Raman spectroscopy of pyrogenic carbon matrices.

