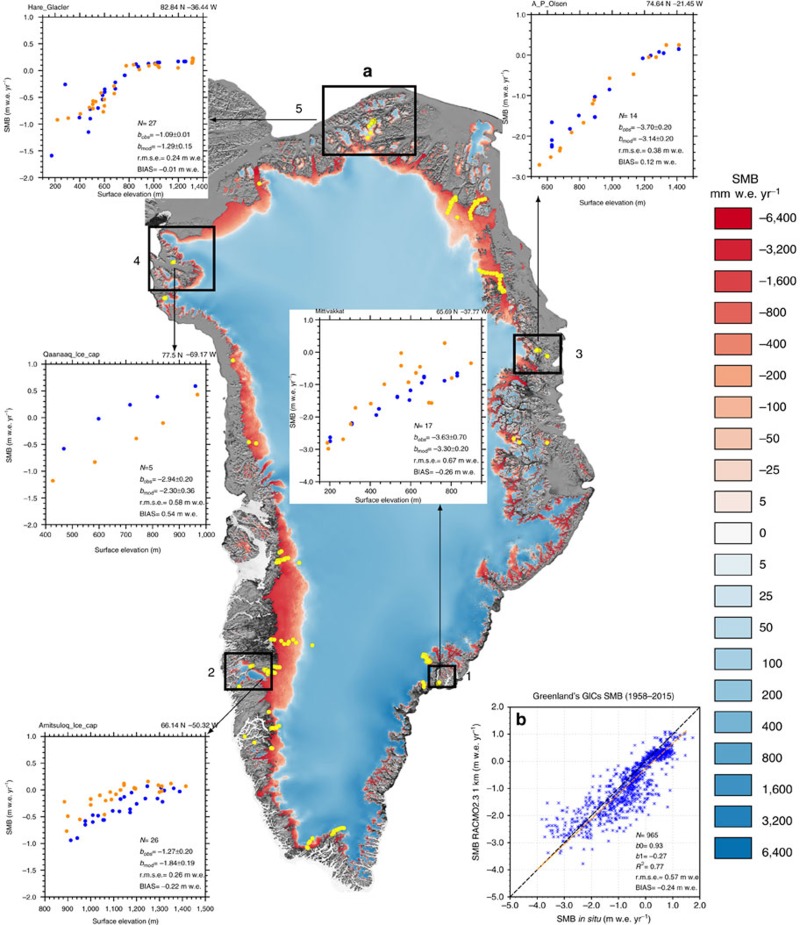
Figure 1. Greenland SMB patterns and evaluation.
(a) Annual mean downscaled SMB (v1.0, see Methods) at 1 km resolution over the GrIS and neighbouring GICs for 1958–2015. Yellow dots correspond to 331 SMB observation sites used for GrIS (230) and GICs (101) evaluation. Numbered black boxes depict five regions including stake transects collected over GICs. For each transect, annual mean SMB is plotted from downscaled simulation v1.0 (bmod; dark blue dots) and in situ data (bobs; orange dots). The number of observations, observed and downscaled SMB gradients, r.m.s.e. and mean BIAS are also listed for each transect. (b) Comparison of ablation measurements collected at 101 GICs sites with downscaled SMB at 1 km (v1.0). The orange dashed line represents the regression including all measurements (y=b1+b0 × x).

