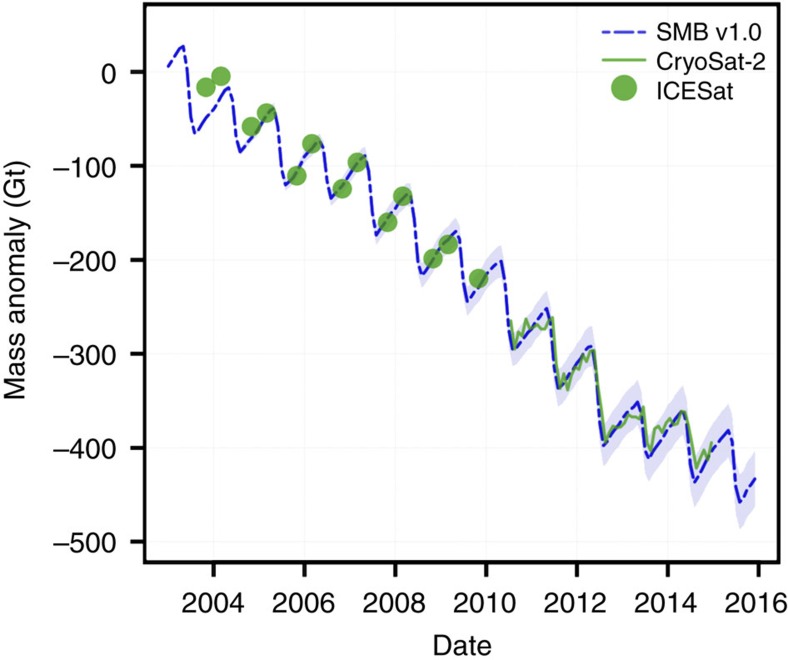
Figure 2. Contemporary Greenland's GICs mass anomaly.
Comparison of Greenland's GICs-integrated mass anomaly (2004–2015) derived from ICESat (green dots)/CryoSat-2 (green line) altimetry with the downscaled SMB v1.0 (dashed blue line). The light blue belt represents the estimated uncertainty of the downscaled SMB product.

