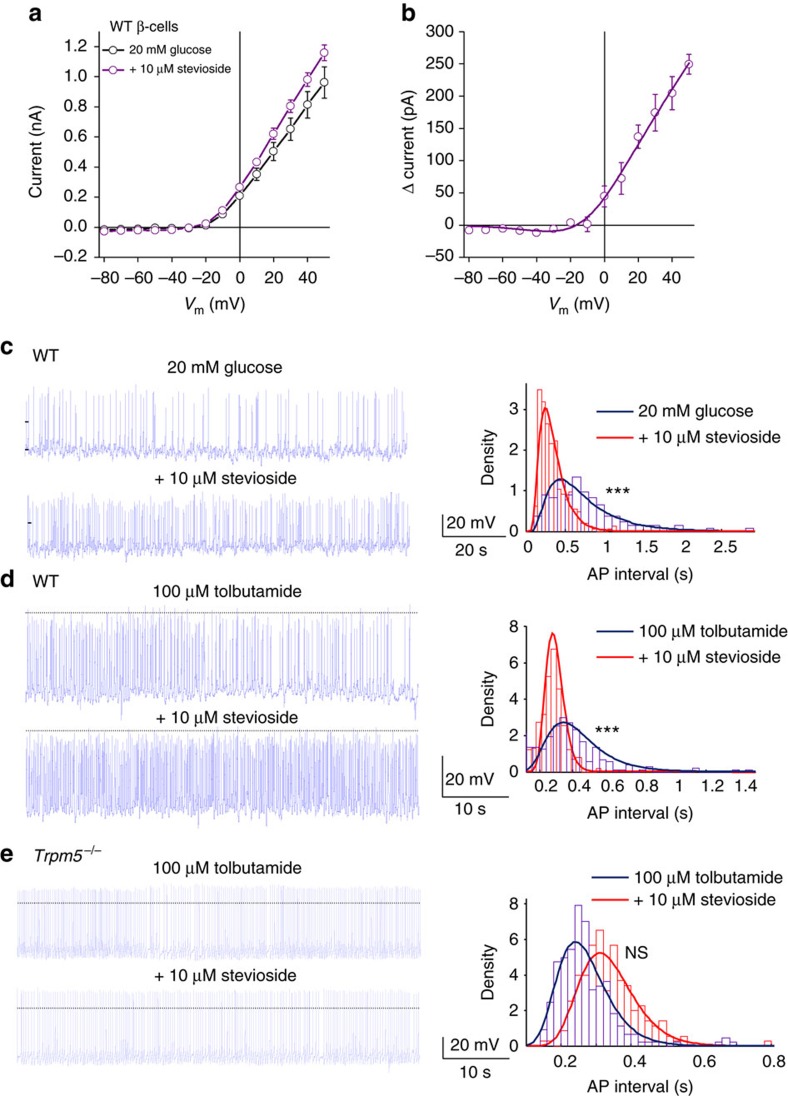
Figure 2. Patch-clamp recordings in isolated β-cells.
(a) The current recorded in primary WT β-cells evoked by 20 mM glucose or 20 mM glucose+10 μM stevioside (average±s.e.m.; n=5 cells). (b) Difference current of the traces in a, highlighting the stevioside contributed fraction of the total current. (c) Left: action potentials (APs) evoked in WT β-cells by 20 mM glucose (top) or 20 mM glucose+10 μM stevioside (bottom). Right: probability density function plot depicting change in AP firing frequency properties. AP interval (s) represents the duration of the interval between APs. Density represents the proportion of intervals between APs that lie within the bin duration, normalized to account for differing bin width. (d) As c but with 100 μM tolbutamide instead of 20 mM glucose. (e) APs evoked in Trpm5−/− β-cells in the presence of 100 μM tolbutamide or 100 μM tolbutamide+10 μM stevioside, as in c (n=4 cells). NS, not significant.

