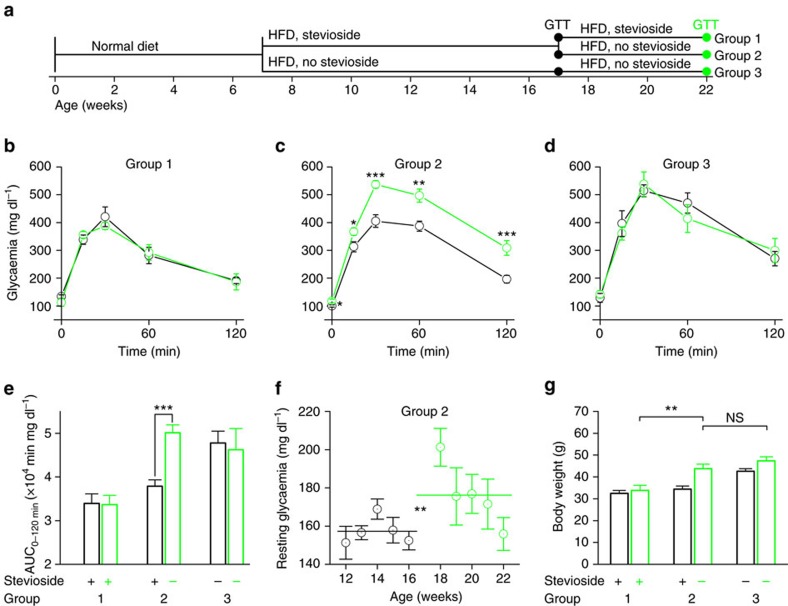
Figure 8. Stevioside effects are rapidly reversible during HFD.
(a) Time line illustrating the course of the diet and stevioside treatment of three groups of mice. Time points of GTT are as indicated. (b) The results of the GTT after 10 weeks on HFD (black—17 weeks old) and after another 5 weeks (green—22 weeks old) of mice on HFD+stevioside (100 mg l−1 in drinking water). (c) GTTs of mice on the same time points as (b) with stevioside treatment terminated at the age of 17 weeks. Individual points indicate the average±s.e.m. and the significances are the result of a paired sample t-test at the same time point from the two GTTs. (d) GTTs of mice in the untreated control group at the same time points. All values are averages±s.e.m. of n=8–10 mice. (e) Average±s.e.m. area under the curve (AUC) from the experiments in b–d, paired sample t-test, only significant differences are indicated. (f) The weekly average±s.e.m. resting glycaemia (spheres) and the average over 5 weeks (lines) of the mice in group 2 during (black) and after (green) the stevioside treatment. Two-sample t-test between the average glycaemia during and after stevioside treatment (lines). (g) Average±s.e.m. Body mass of the three groups at the age of 17 weeks (black) and 22 weeks (green) before the fasting for the GTT (two-sample t-test). See also Supplementary Fig. 14 and Supplementary Table 3. NS, not significant.

