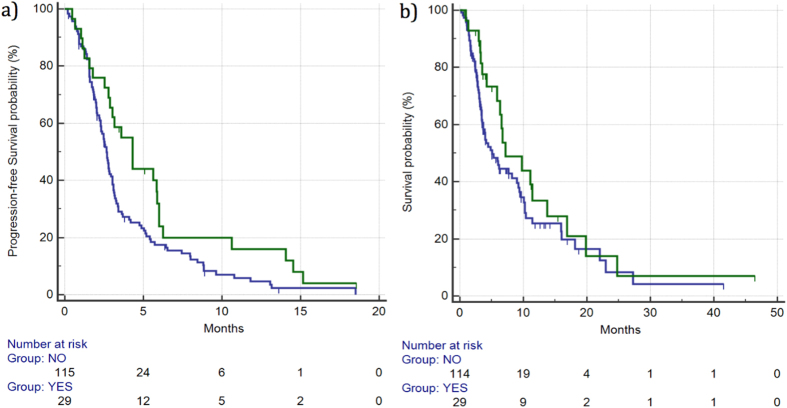
Figure 3.
Median PFS (a) and OS (b) for patients who developed ≥grade 2 hypertension ( ) vs patients with grade 0–1 hypertension (
 ). Median PFS was 4.32 vs 2.65 months (HR: 0.61, 95%CI: 0.41–0.89, p = 0.0197), respectively, whereas median OS was 7.18 vs 5.04 months (HR: 0.71, 95%CI: 0.45–1.13, p = 0.188), respectively.

