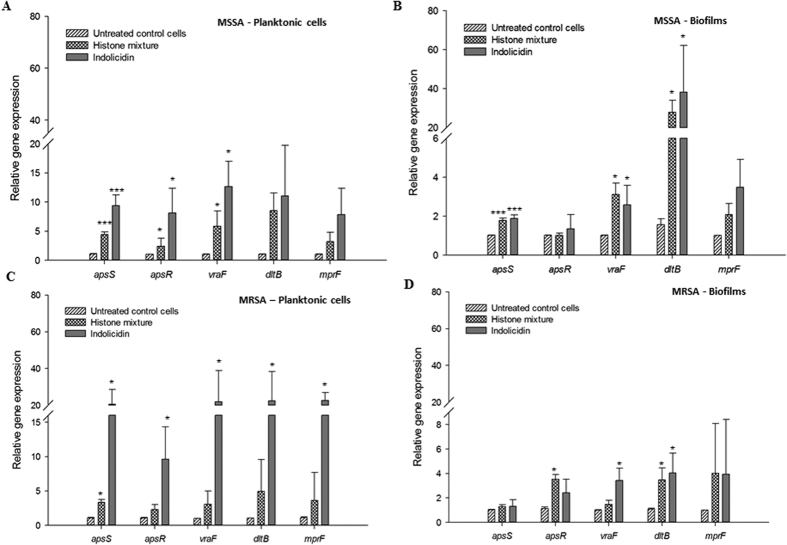
Figure 4. Effect of avian histones on the relative transcripts levels of the genes associated with the AMP resistance mechanisms.
(A) Planktonic MSSA cells; (B) MSSA cells embedded in biofilms; (C) Planktonic MRSA cells; (D) MRSA cells embedded in biofilms. Values represent mean fold change expression differences compared to untreated control cells ± standard deviation from three independent experiments; *P < 0.05, ***P < 0.001. Calculations of significant differences are versus the corresponding control without addition of CAMP.

