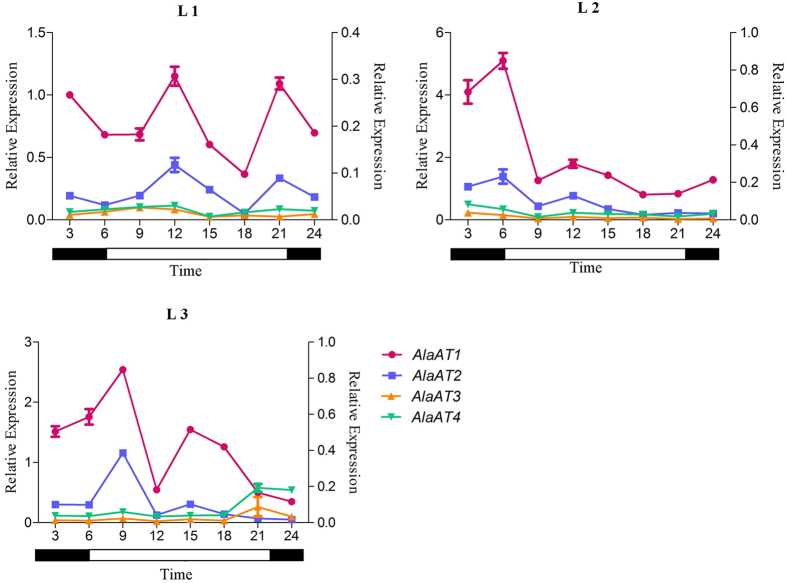
Figure 7. Diurnal fluctuation of expression patterns of PnAlaAT genes in leaves.
Quantitative RT-PCR was performed using total RNA extracted from leaves. PnAlaAT1 and PnAlaAT2 refer to the left Y axis and PnAlaAT3 and PnAlaAT4 refer to the right Y axis. Results are the mean ± SE of three replicates.

