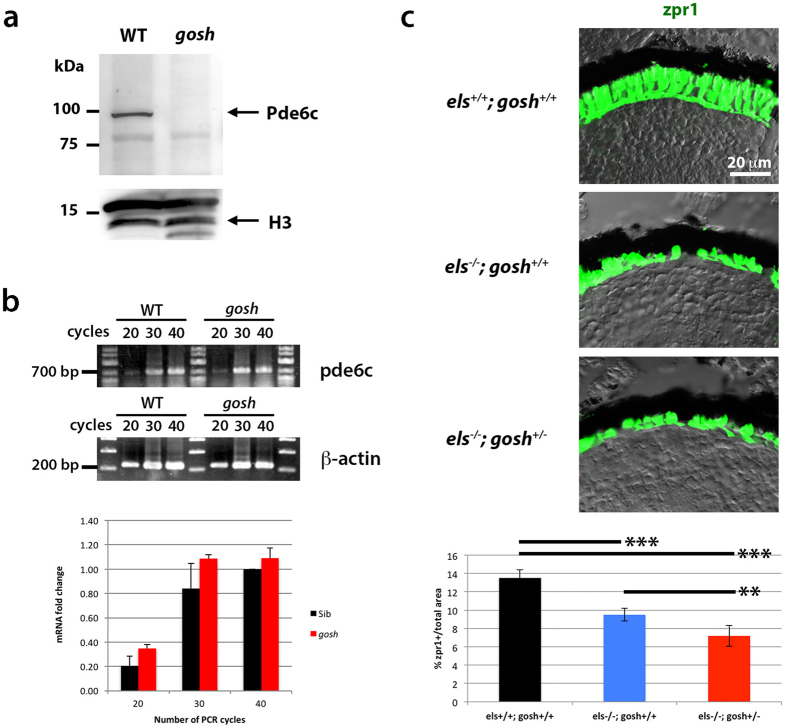
Figure 4. The gosh mutant genetically interacts with the els mutant.
(a) Western blot of wild-type and gosh mutant heads with anti-Pde6c antibody. A band of approximately 100 kDa was detected in wild type animals, but disappeared in the gosh mutant. Histone H3 is as a loading control. (b) Semi-quantitative PCR with different numbers of cycles (20, 30 or 40) indicates that mRNA levels are similar between wild-type zebrafish and the gosh mutant. (c) Labeling of els+/+;gosh+/+, els−/−;gosh+/+, and els−/−;gosh+/− retinas with the zpr1 antibody. The ratio of zpr1-postive area relative to the total retinal area is significantly decreased in els−/−;gosh+/− retinas compared to els−/−;gosh+/+ retinas. ANOVA was significantly different (p< 0.000016) by t-test with a Bonferroni correction post-hoc (*p < 0.05; **p < 0.01; ***p < 0.001).

