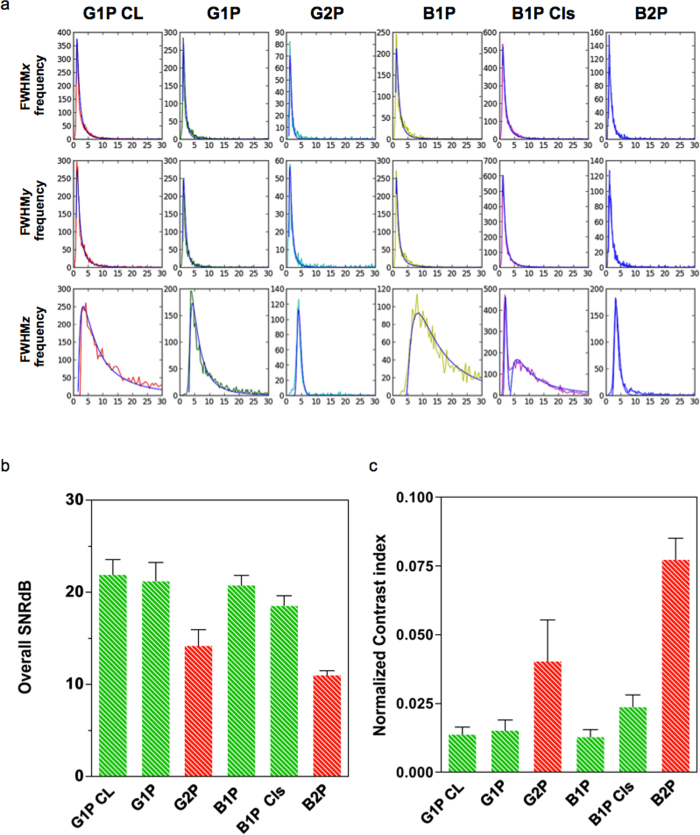
Figure 2. 3D PSF, SNR and contrast comparison for MCTS imaged by different light sheet illumination modalities.
(a) Distributions and lognormal fits (superimposed in blue) of the obtained FHWM values for each modality. Horizontal axes are in μm and vertical axis in counts. (b) SNR mean values for each modality in decibels (dB). (c) NCI mean values for each modality. All error bars are the s.d.

