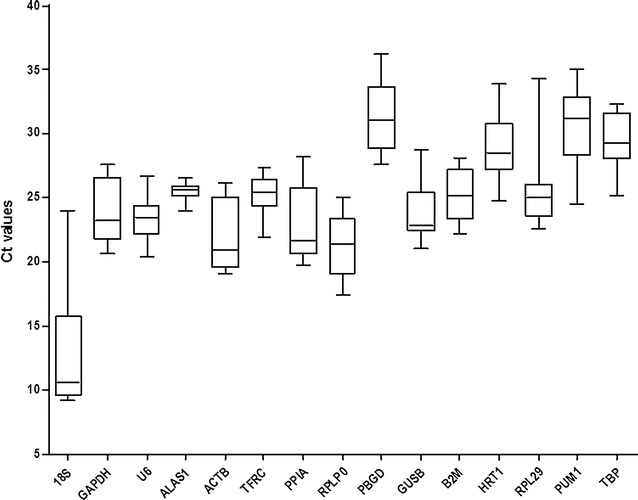
Fig. 1.

Ct values of 15 candidate reference genes in all samples. Raw Ct values of eight samples, under normal conditions and different concentrations of H2O2, are described using a box and whisker plot. The outer box is determined from the 25th to the 75th percentiles, and the line across the box is the median
