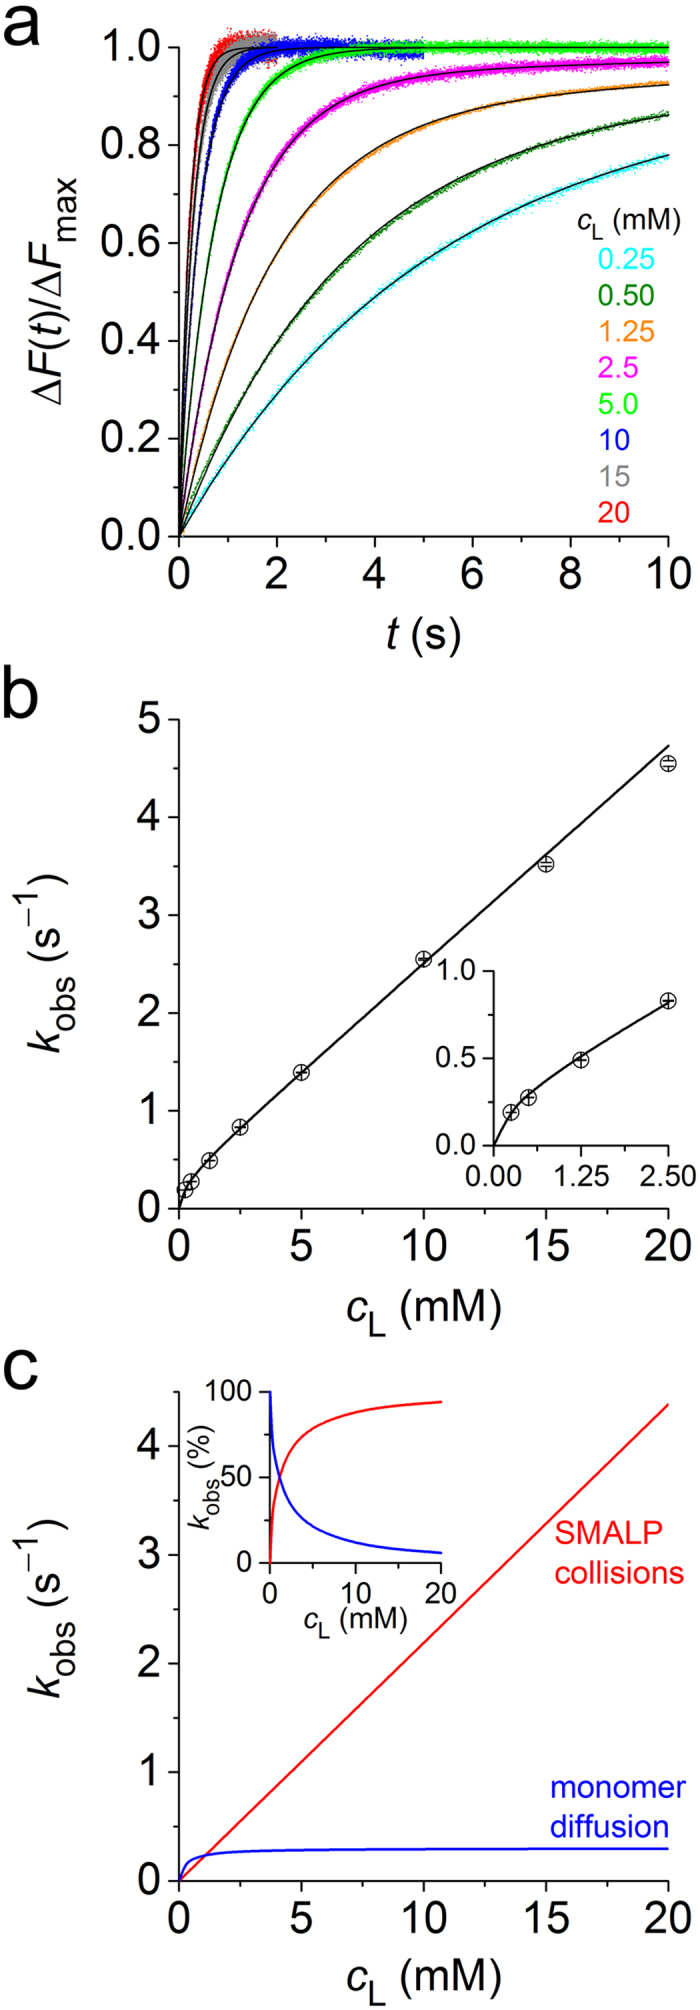
Figure 1. Transfer of fluorescently labelled lipids as monitored by TR-FRET at 30 °C.

(a) Normalised NBD-PE fluorescence emission, ΔF(t)/ΔFmax, versus time, t, upon mixing labelled SMALPs at a total lipid concentration of 0.25 mM with unlabelled SMALPs at various cL. Shown are experimental data (coloured dots) and a global fit (solid lines) based on equation (5). (b) Lipid exchange rate constants, kobs, derived from local fits to data in panel a according to equation (4) (open circles) and results from a global fit (solid line) according to equation (5). Error bars are 95% confidence intervals of local fits. Inset: Zoomed view at low cL. (c) Absolute contributions to kobs of diffusional and collisional processes. Inset: Same data as relative contributions.
