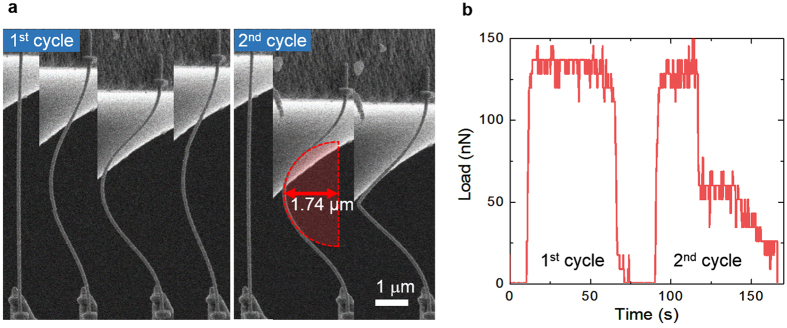
Figure 3. Cyclic compressive loading tests of the five-fold Ag NW and its corresponding load–time curve.
(a) A series of SEM micrographs showing the cyclic buckling phenomena of an Ag NW under compressive load. In the second cycle, the Ag NW is fractured under a compressive strain that exceeds the fracture threshold of 1.74 μm ROC. (b) A load–time curve corresponding to the cyclic compressive loading tests; the curve shows the stress required for buckling.

