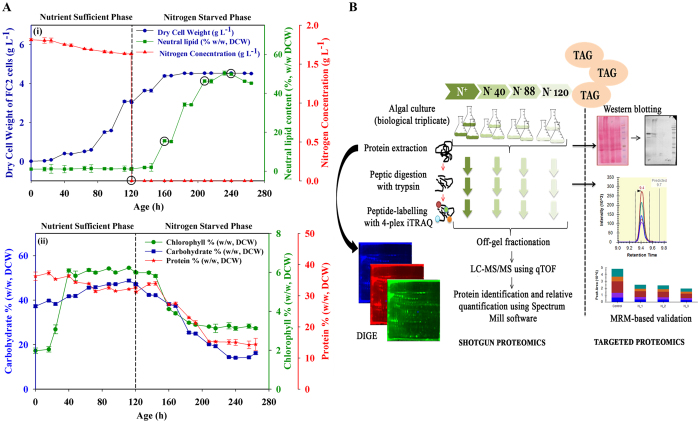
Figure 1. Differential expression studies of FC2 as a function of time till 160 h of N-starvation.
(A) Physiological studies of FC2 in nitrogen sufficient and starvation conditions. (i) Dynamic profiles of nitrogen utilization, dry cell weight and neutral lipid accumulation; the time-points encircled (0, 40, 88 and 120 h) were selected for proteomics study (ii) comparison of protein, carbohydrate and chlorophyll content. The experiments were conducted in biological triplicate and the data obtained were expressed as mean ± standard error. (B) Schematic representation of the experimental strategy used for comparative analysis of differentially expressed FC2 proteome.

