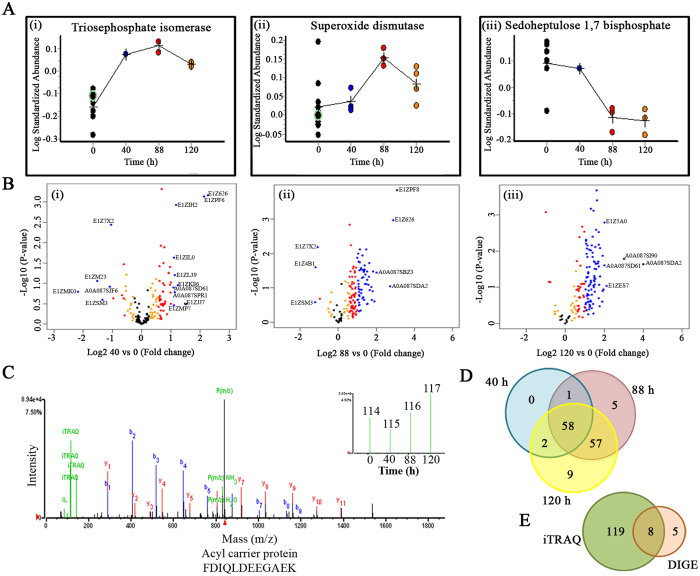
Figure 2. Shotgun proteomics study of FC2 exposed to varied N-starvation conditions.
(A) Comparative fluorescence intensities of few selected statistically significant (p < 0.05; paired t-test and one-way ANOVA) proteins expressed differentially during N-starvation identified in biological variation analysis (BVA) using DeCyder 2D software; (B) Volcano plots showing P values (−log10) versus protein ratio of (log2). Blue > 2 fold change; red > 1.5 fold change, orange > 1.2 fold change and black- no significant change (p-value > 0.05). A few selected differentially abundant proteins are labelled; (C) Representative MS/MS spectra of ACP showing higher accumulation with progressive N-starvation time; (D) Venn diagram showing the unique and overlapping differentially abundant proteins (p-value ≤ 0.05) in different N-starvation time points.; (E) Venn diagram showing the unique and overlapping proteins identified in iTRAQ and DIGE.

