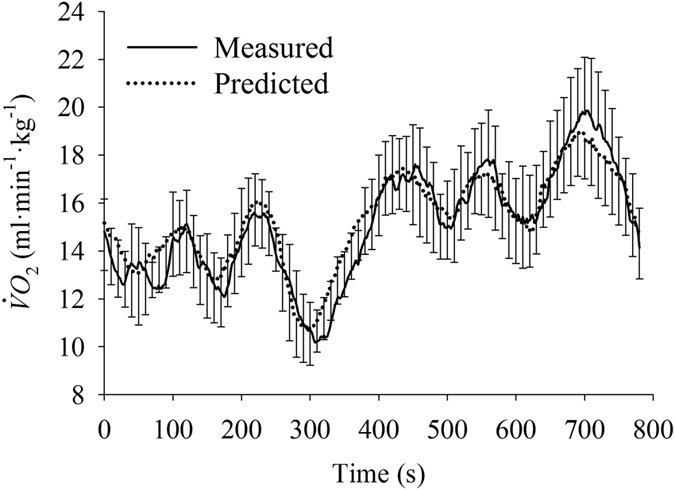
Figure 5. Second-by-second mean (lines, n = 16 per point) of the measured and predicted oxygen uptake ( ) during pseudorandom ternary sequence over-ground walking protocol.

The SD (upward vertical bars for measured values, downward for predicted) are plotted at 10 s intervals.
