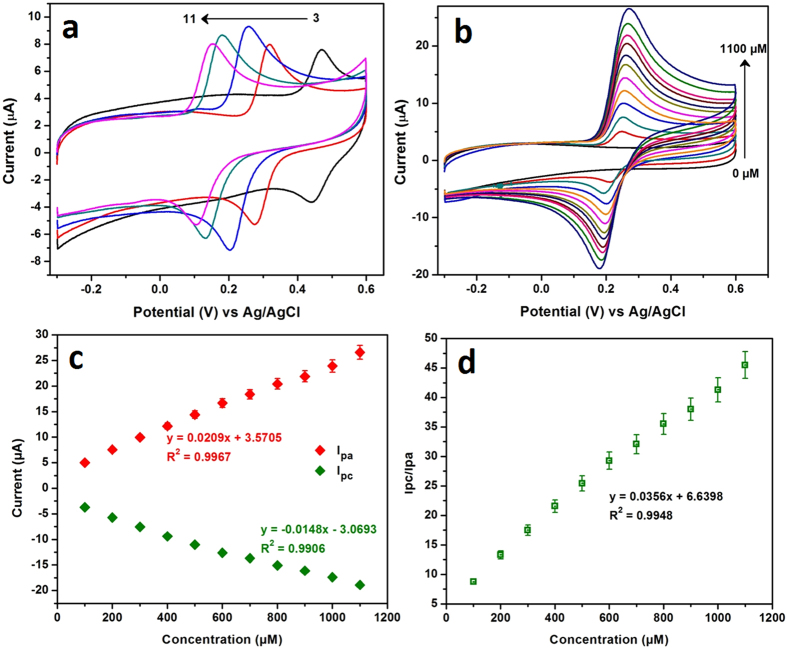
Figure 4.
The CV responses of the oxidation of CA at NDC/GCE in various pHs ranging from 3.0 to 11.0 (a). The CV curves of NDC/GCE in various concentrations of CA ranging from 0 to 1100 μM (b) and the corresponding plot of redox peak current vs. concentration of CA (c). The ratio of the redox peak currents of CA is plotted against the concentration of CA, which follows the linearity with the slope of 0.0356 (d).

