Figure 5.
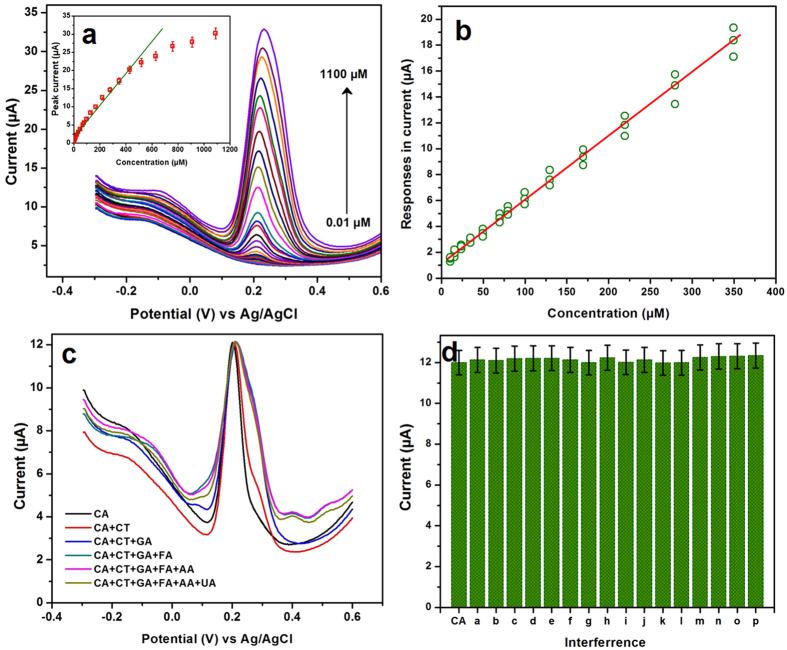
The DPV responses of NDC/GCE in various concentrations of CA from 0.01 to 1100 μM in 0.05 M PB solution (a) and the corresponding calibration plot shown in inset. (b) Calibration data for the determination of CA by the DPV method for three duplicated measurements with n standards. (c) The DPV responses of CA oxidation in presence of potential interference, such as catechol (CT), gallic acid (GA), ferulic acid (FA), ascorbic acid (AA) and uric acid (UA) (b). (d) The DPV interference signals of CT (a), GA (b), FA (c), AA (d), UA (e), Na+ (f), K+ (g), Mg2+ (h), Ni2+ (i), Cu2+ (j), Cl− (k), NO3− (l), SO42− (m), glucose (n), DA (o) and H2O2 (p) where CA is the standard for comparison.

