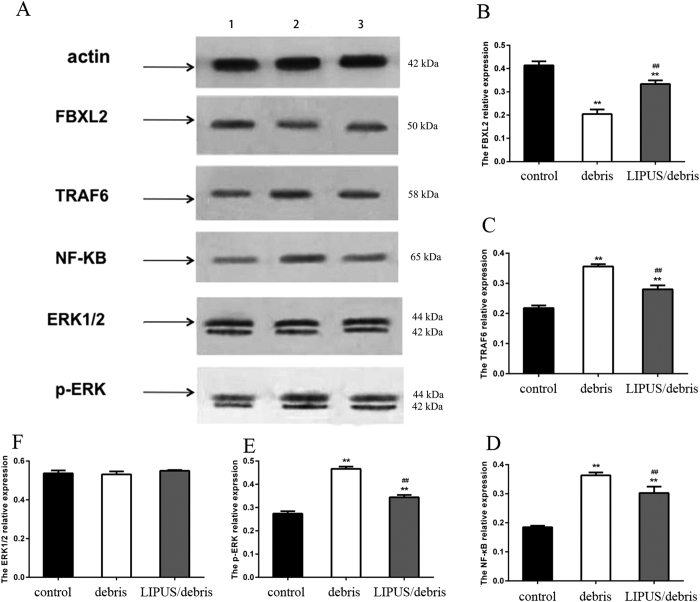
Figure 3. Group 1 is control group; group 2 is debris group; and group 3 is LIPUS+debris group.
This figure shows the change of proteins expressions(FBXL2, FBXL6, NF-κB, and ERK) in western blot(**p < 0.01 vs. control gourp; ##p < 0.01 vs. debris group). Full-length blots are included in the Supplementary Figure S1.

