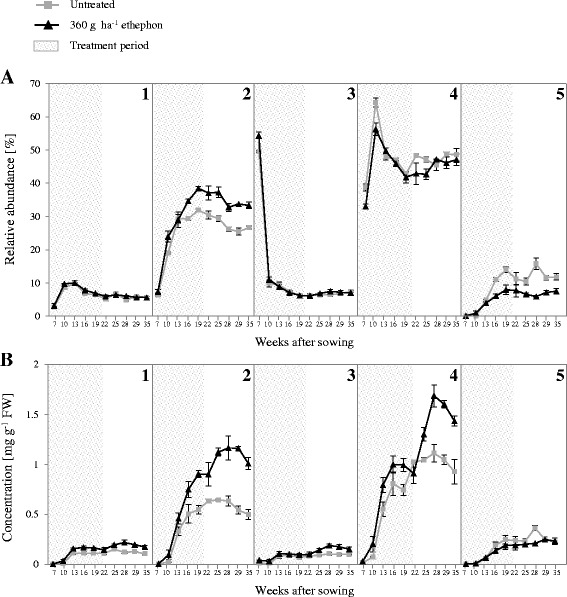
Fig. 5.

Anthocyanin composition monitored in roots of untreated and 360 g ha−1 ethephon-treated black carrot plants (7–35 weeks after sowing). (a) Relative abundance (%) of each anthocyanin form calculated from integration of the corresponding chromatogram peak area. (b) Concentration of each anthocyanin form estimated based on total anthocyanin content (TMA) and relative abundance of each peak. Peak identification (1–5) is shown in Table 3. Data represent the mean ± SE, n = 3
