
Figure 2.
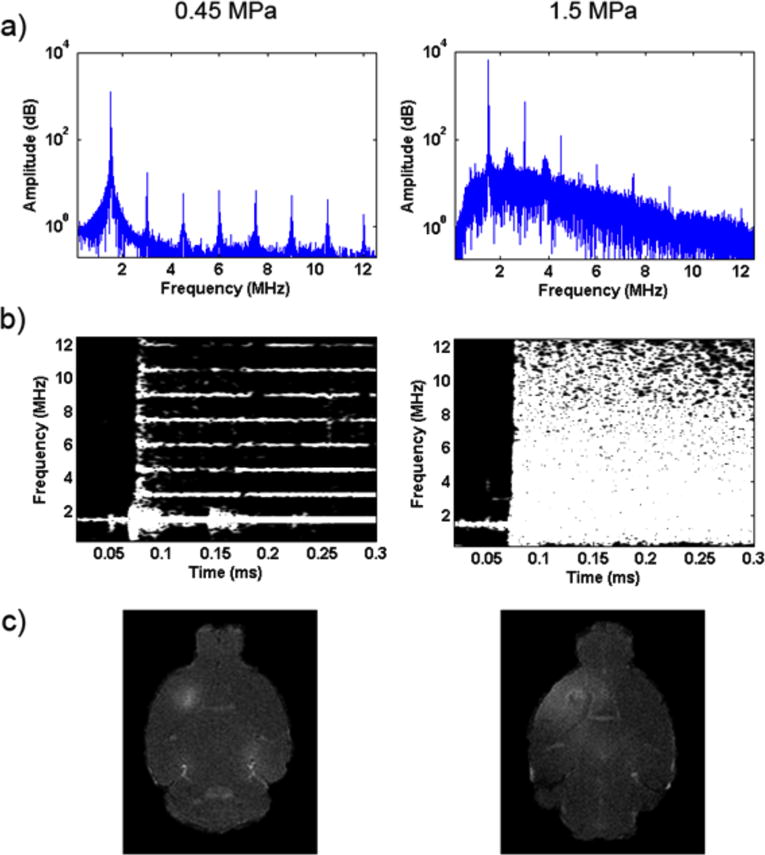
(a–b) PCD spectrogram for 0.45 MPa and 1.5 MPa. 1.5 MPa (positive control) showed strong broadband noise indicating inertial cavitation while 0.45 MPa remained within the stable cavitation threshold. (c) Contrast-enhanced T1 MRI image for the 1.5 MPa (positive control) group showed more dispersed diffusion of gadolinium rather than the localized diffusion of 0.45MPa.