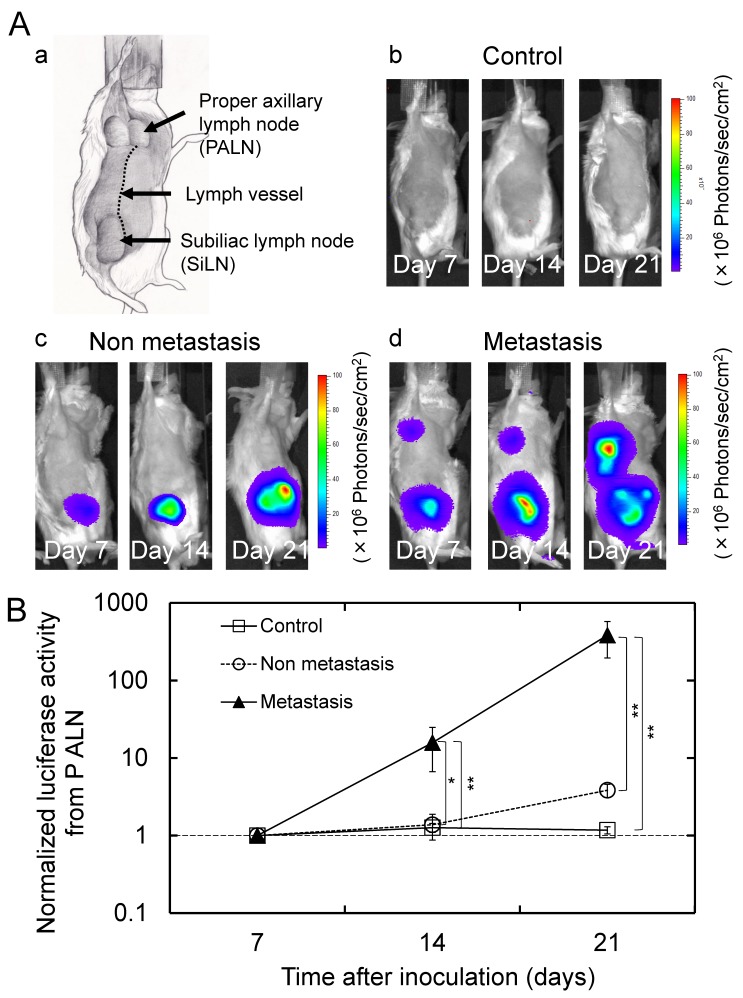
Figure 1.
Lymph node metastasis model (Aa) Anatomical drawing of an MXH10/Mo/lpr mouse. (Ab, c, d) Representative in vivo bioluminescence images obtained from mice in each group. Mice in the metastasis group demonstrated an increase in the bioluminescence signal intensity from the PALN. (B) Longitudinal analysis of the normalized luciferase activity in the PALN (n = 10 for the control group; n = 6 for the non-metastasis group; and n = 10 for the metastasis group). The values at different time points were normalized to those on day 7. On days 14 and 21, the normalized luciferase activity in the PALN was significantly higher in the metastasis group than in the non-metastasis and control groups. Mean ± SEM values are shown. *P < 0.05; **P < 0.01.

