Figure 3.
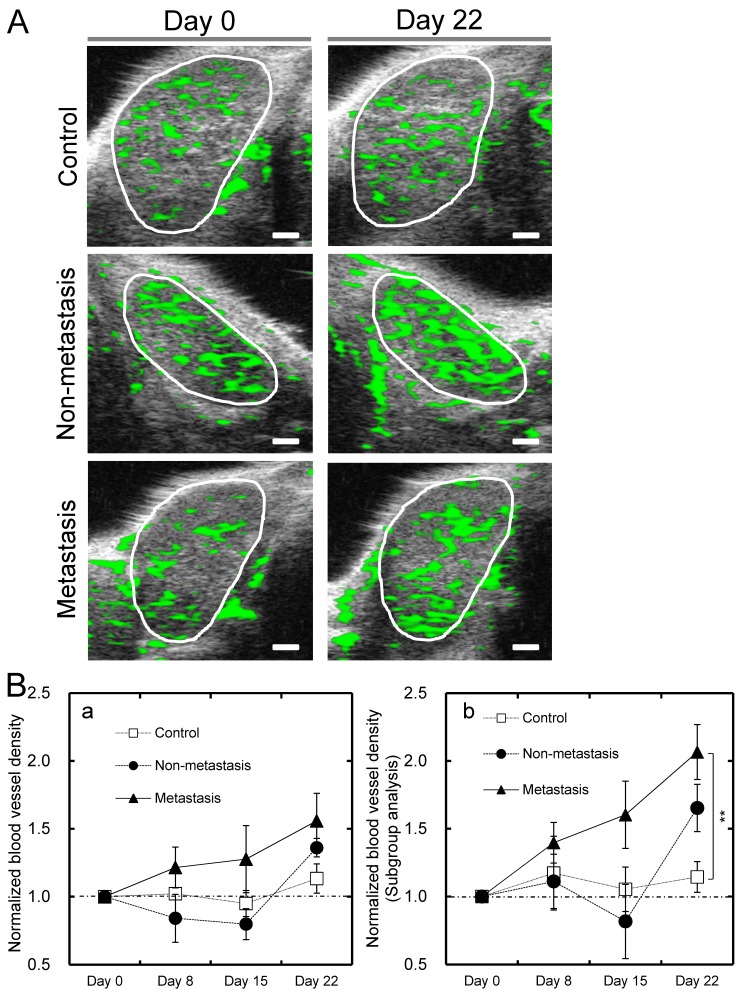
Blood vessel density in the PALN measured by CE-HFUS imaging (A) Representative vascular extraction images for each group, taken from the widest cross-section of the PALN on days 0 and 22. The white circles indicate the boundary of each PALN. In the control group, there were no obvious differences in vessel structure between the US images obtained on days 0 and 22. In vascular extraction images from the non-metastasis and metastasis groups, the proportion of the PALN colored green was higher on day 22 than on day 0. (B) A longitudinal analysis of the normalized blood vessel density of the PALN in each group. The normalized blood vessel density of the PALN in the metastasis group progressively increased and showed a trend toward being higher than that in the other two groups on days 8, 15 and 22; however there were no statistically significant differences between the groups (Fig. 3Ba; n = 10 for the control group; n = 6 for the non-metastasis group; and n = 10 for the metastasis group). Additional analysis was performed in mice in which the PALN had an initially low blood vessel density (blood vessel density < 35% on day 0) (Bb). A significant difference was demonstrated between the control and metastasis groups on day 22 (P < 0.01; n = 6 for the control group; n = 3 for the non-metastasis group; and n = 5 for the metastasis group). **P < 0.01. Scale bars represent 1 mm.

