Figure 4.
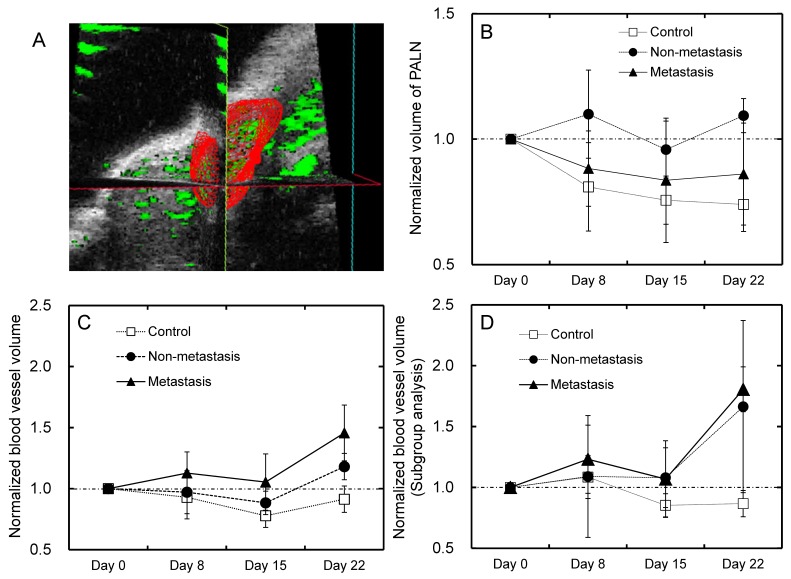
Analysis of PALN volume and blood vessel volume of the PALN (A) Representative three-dimensional images of the PALN on day 0 in the control group. The PALN did not contain tumor cells. (B) The volume of the PALN was measured for each group. None of the groups showed any significant changes in PALN volume during the experimental period. (C) The normalized blood vessel volume of the PALN in the metastasis and non-metastasis groups appeared to increase between days 15 and 22, although there were no significant differences between any of the groups (n = 10 for the control group; n = 6 for the non-metastasis group; and n = 10 for the metastasis group). (D) Additional analysis was carried out in mice in which the PALN had an initially low blood vessel density (blood vessel density < 35% on day 0). There was a trend toward a higher normalized blood vessel volume in the metastasis and non-metastasis groups compared to the control group, although statistical significance was not reached (n = 6 for the control group; n = 3 for the non-metastasis group; and n = 5 for the metastasis group).

