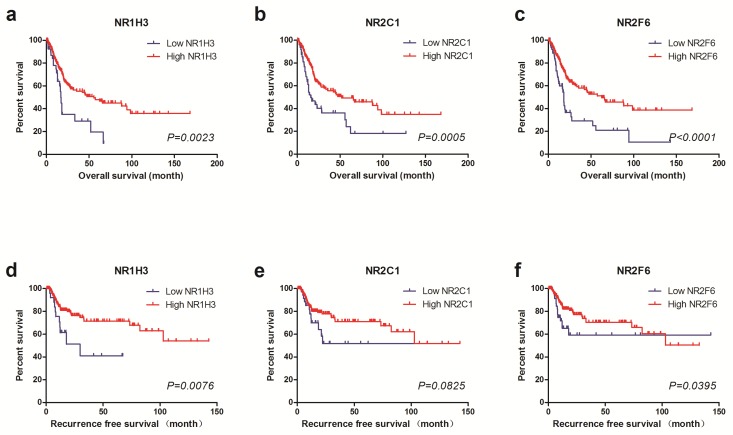
Figure 1.
Kaplan-Meier plots of survival in TCGA cohort are shown according to NR1H3, NR2C1 and NR2F6 expression. a, b, c Kaplan-Meier estimates of overall survival (OS) are shown according to NR1H3, NR2C1 and NR2F6 expression. d, e, f Kaplan-Meier estimates of recurrence free survival (RFS) are shown according to NR1H3, NR2C1 and NR2F6 expression.

