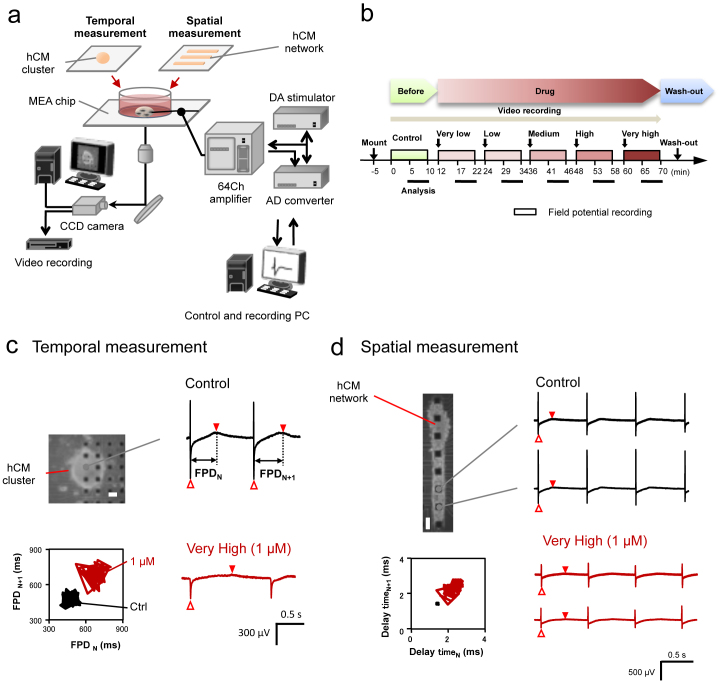
Figure 1. On-chip cell-network cardiotoxicity measurement using human cardiomyocytes.
(a), Schematic diagram of on-chip cell-network multielectrode array (MEA) system for spatiotemporal functional measurement of cardiomyocyte networks using human cardiomyocyte (hCM) clusters for temporal aspect and rectangle hCM lined-up networks for spatial aspect (Fig. 1a is original and was drawn by K.Y., F.N., and T.H.). (b), The experimental protocol was designed for five-step increase of concentrations doses in each compound. Before recording, the incubated hCMs on the MEA chip was set in the system and placed for 5 min. Each step of recordings was for 10 min started from just after the compound application, and the last 5 min of the recording was adopted for analysis. After the experiments, the medium in the chip was exchanged into fresh medium for washing. (c), (d), field potential (FP) waveforms obtained from the hCM cluster for temporal measurement of FP duration (FPD) fluctuation (c), and from the lined-up hCM network for spatial measurement (d) in presence of compound (E-4031). Each phase contrast image was shown the hCM cluster (c) and the lined-up hCM network having same amount of cardiomyocytes (d) used for the experiments. Bars, 100 μm. The represented FP waveforms of 1 μM (the fifth- top dose very high concentration in (b)) were compared to those of control. The FPD for (c) was the time between the first inward sodium peak (open triangle) and second outward peak (closed reverse triangle). The conduction time for (d) was calculated from the propagation time of sodium inward peak (open triangle) of FP waveforms of cells on the neighboring electrodes. The fluctuations of the FPD and the conduction (delay) time after the addition of 1 μM E-4031 were shown in the lower graphs as Poincaré plottings.

