Figure 3.
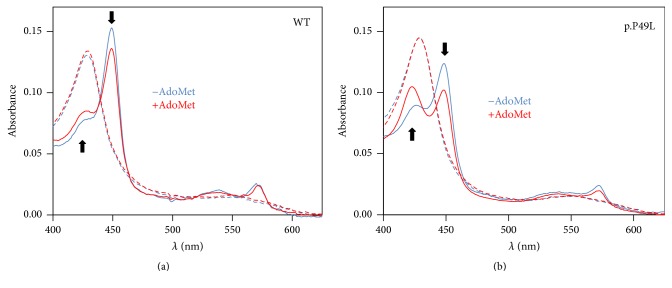
Absorption spectra of WT and p.P49L CBS. Absorption spectra of WT (a) and p.P49L (b) CBS (1.4–1.6 µM in heme) recorded at 20°C, in degassed buffer A (50 mM KPi, 300 mM KCl, 10% glycerol, 100 μM EDTA, pH 7.0), containing glucose oxidase (4 units·ml−1), catalase (13 μg·ml−1), superoxide dismutase (12 units·ml−1), and glucose (3 mM). Spectra were collected in the oxidized state (dashed lines) and upon protein reduction (solid lines) by addition of 90 μM sodium dithionite, in the absence (blue lines) and presence (red lines) of AdoMet (500 μM). Arrows highlight direction of the spectral changes caused by AdoMet in the reduced proteins.

