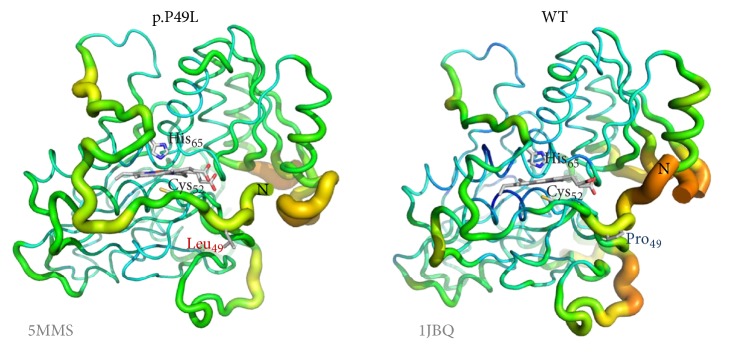
Figure 6.
Increased flexibility of the heme binding loop in p.P49L CBS. Representation of B factor variation along the structure of CBS p.P49L (PDB entry 5MMS) and WT (PDB entry 1JBQ) monomer, displaying in first plane the regions encompassing the proline-to-leucine mutation (sticks) and the heme ligands C52 and H65. Flexibility can be visualized both by the thickness of the structural element and the respective color: highest flexibility represented in red (hot) thick elements; lowest flexibility in thin blue (cold) elements (color scale: red > orange > yellow > green > blue). Figure generated with PyMOL 1.8.2 (The PyMOL Molecular Graphics System, Version 1.8 Schrödinger, LLC).

