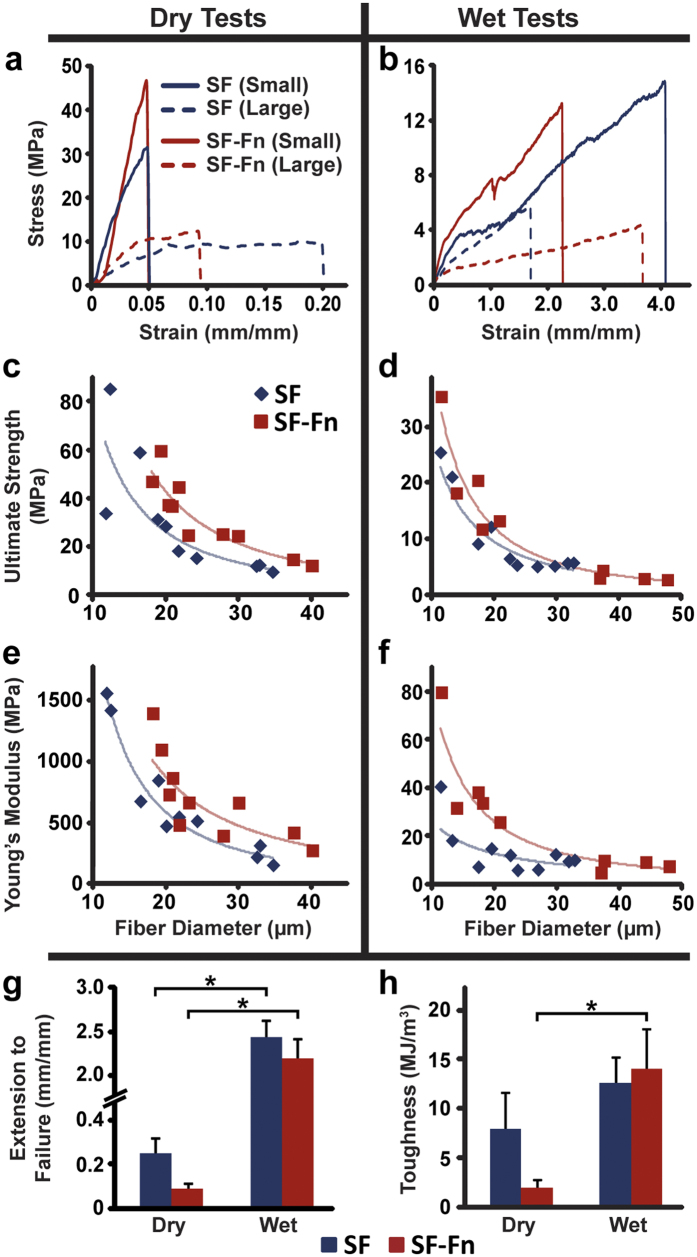
Figure 2. Mechanical data of the control and alloy fibres in dry and wet conditions.
(a,b) Representative stress-strain curves for small diameter (less than 20 μm) and large diameter (greater than 30 μm) fibres are shown from which the mechanical properties are calculated (N = 10 for all except wet SF-Fn, N = 9). (c–f) Raw data of ultimate strength and Young’s modulus plotted against diameter demonstrate a dependent relationship. Power regression lines fitted to the data show a general right-shifting of the curve for the alloy fibres. (g) Extension to failure is not coupled to fibre diameters and is generally lower for alloy fibres. (h) Material toughness does not change significantly from control to alloy fibres. *Indicates statistical significance.

