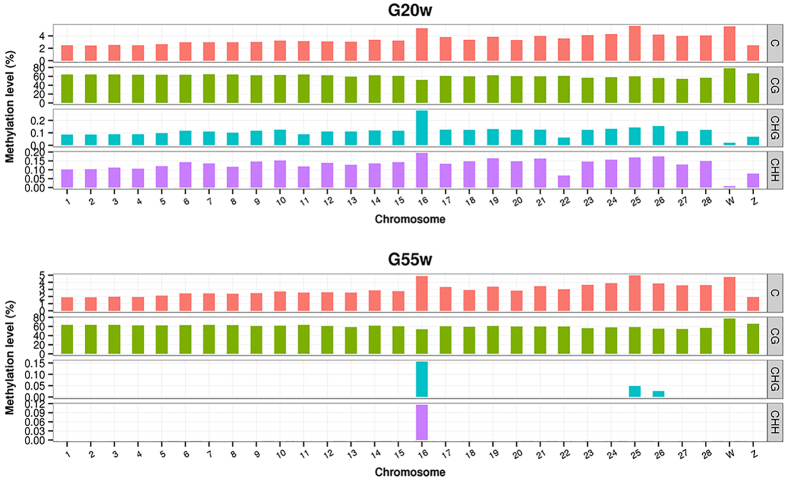
Figure 2. Chromosome distribution of methylation level in various sequence contexts in two groups.
The distribution of methylation level in chromosomes 1–28 and the Z, W chromosome of the chicken genome were shown in histogram for each sample. mC signifies 5-methylcytosine. H = A, C, or T. Chromosome numbers and scales are indicated on the periphery (mCG level = mCG/CG).

