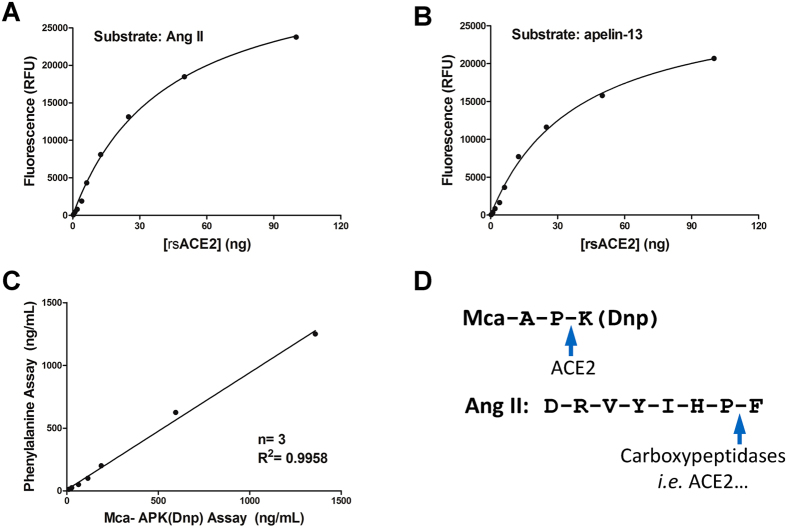
Figure 3.
(A,B) Dose-response curves for rsACE2 by the phenylalanine assay. A shows reaction with 10 nmol Ang II peptide; and B with 10 nmol apelin-13 peptide. (C) The ACE2 activities as separately measured by the Ang II phenylalanine assay and the Mca-APK(Dnp) assay strongly correlate with each other. (F) Distinct amino acid sequences of Mca-APK(Dnp) and Ang II. The arrows point to the peptide bonds cleaved by ACE2, and in the case of Ang II also by other carboxymonopeptidases.

