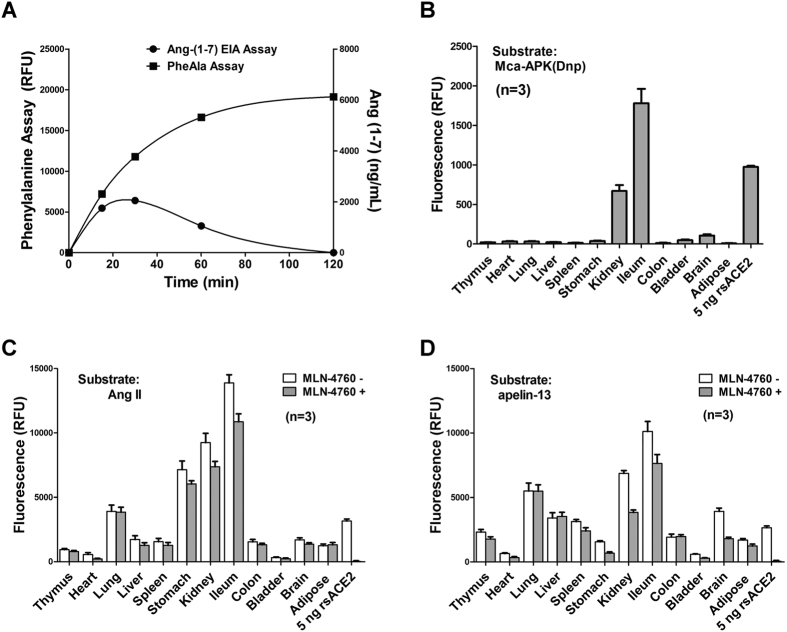
Figure 6. Tissue distribution of carboxypeptidase activities for Ang II and apelin in mice.
(A) Concurrent formations with distinct dynamic trends of phenylalanine and Ang-(1-7) following the incubation of Ang II with mouse kidney lysate. (B) ACE2 activity in mice tissue lysates (10 μg) was measured by the Mca-APK-Dnp method. Carboxypeptidase activities for Ang II (C) and apelin-13 (D) in mouse tissues were measured by the phenylalanine assay. The results are expressed as the means ± SD of three independent experiments.

