Figure 3.
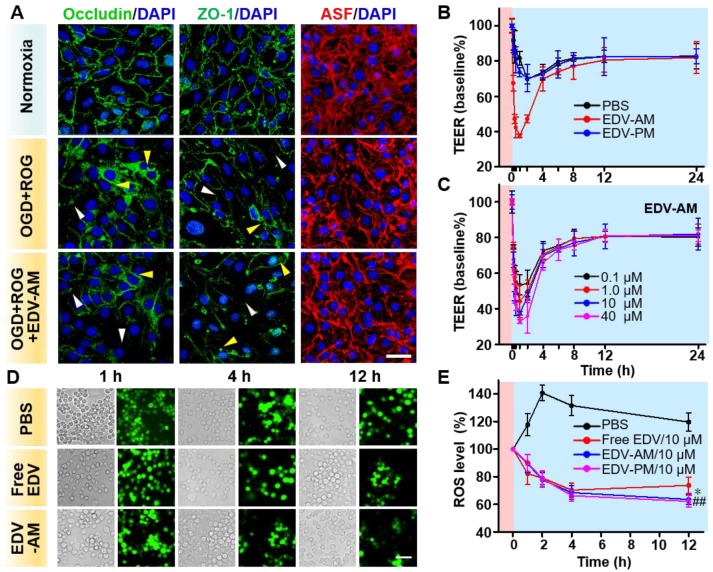
Agonistic micelles tune endothelial monolayer permeability and eradicate OGD-induced intracellular ROS. (A) Fluorescence microscopic images of TJ-associated proteins ZO-1, occluding, and actinomyosin stress fibers (ASF) in endothelial bEnd.3 monolayer after the treatment of normoxia, OGD (2 h) followed by ROG (2 h), or OGD (2 h) followed by ROG (2 h) plus EDV-AM (10 μM). ASF stained with phalloidin is displayed in red, immunofluorescence of ZO-1 and occludin is in green, nuclei stained with DAPI are in blue. White and yellow arrow heads point to the disrupted paracellular TJ proteins and the translocated TJ proteins in the perinuclear area. Scale bar, 50 μm. (B) Time-dependent TEERs of OGD-treated bEnd.3 cell monolayer after addition of PBS, EDV-AM or EDV-PM (10 μM). Magenta and cyan backgrounds indicate OGD and reoxygenation stages, respectively. (C) TEERs of OGD-treated bEnd.3 monolayer as functions of EDV-AM concentrations. (D) White light and fluorescence images of OGD-treated live RAW264.7 microphage cells at selected time-points post addition of PBS, free EDV, or EDV-AM. (E) Normalized intracellular ROS level as a function of incubation time after addition of EDV-AM, free EDV, or PBS. * P < 0.05, EDV-AM vs. free EDV group; ## P < 0.01, EDV-AM vs. PBS group, OGD: oxygen and glucose deprivation. ROG: reoxygenation.

