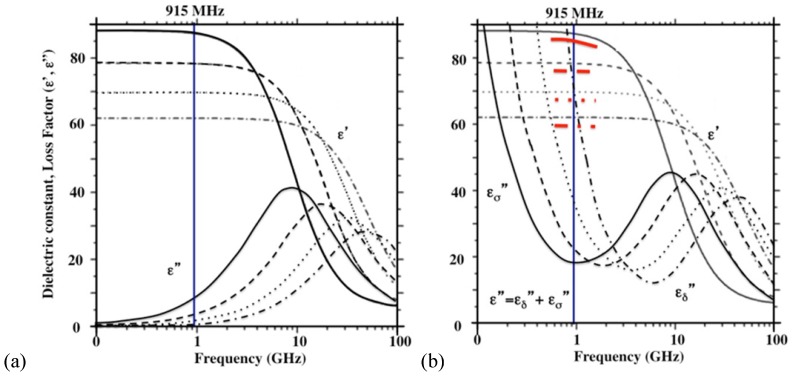
Figure 8.
The schematic dielectric properties (dielectric constant and loss factor ( ) of pure water (a) and an ionic solution (b; 0.5 N NaCl) affected by frequency and temperature change. Each curve represents a particular temperature: a solid line (0 oC); a broken line (25 oC); a dotted line (50 oC); a dotted-broken line (75 oC). Figure 8 is obtained by modifying the original plots as shown in references.17-19

