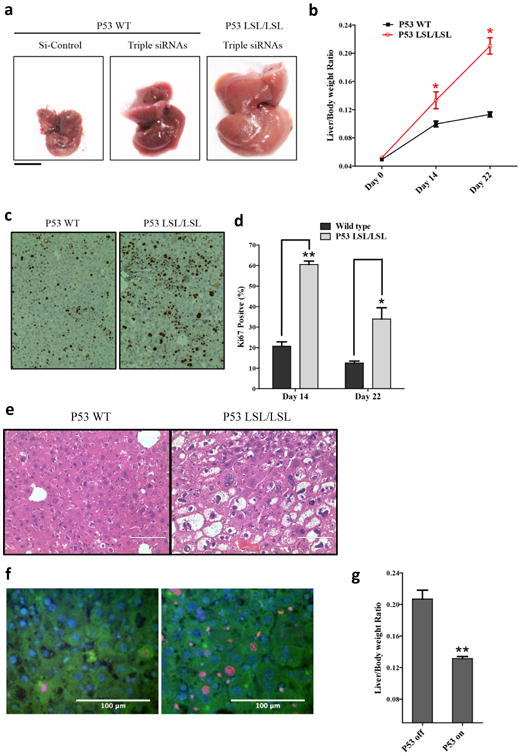
Figure 5. p53 plays an important role in restraining liver growth.

a, Macroscopic views of livers (Day 22). b, Liver/body weight ratio at different time points. Error bars represent SEM, *, p<0.05 (N=4). c, Hepatocyte proliferation evidenced by ki-67 staining (Day 14). d, Quantification of ki-67+ cells. Error bars represent SEM, **, p<0.01, *, p<0.05 (N=3). e, H&E staining of the liver sections (Day 22). f, immunofluorescent staining of ki-67 (red) and keratin 18 (green) of the liver sections (Day 22)., scale bars = 100µm. g, p53LSL/LSL; CreER mice treated with tamoxifen (p53 on) or vehicle controls (p53 off). Liver weight was measured 22 days after the first dose of triple siRNAs. Error bars represent SEM, **, p<0.01 (N≥3).
