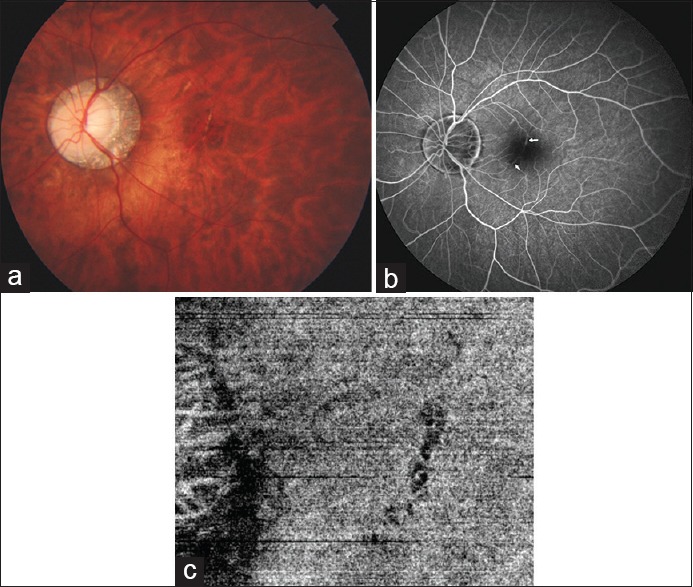
Figure 3.

(a) Fundus image showing a well-defined curved hypopigmented line at the fovea suggestive of a lacquer crack. (b) Fundus fluorescein angiogram highlighting the lacquer crack as a hyperfluorescent line (white arrow). (c) Optical coherence tomography angiography image showing the lacquer crack as a black curved line due to lack of flow detected as an area of lack of decorrelation signal
