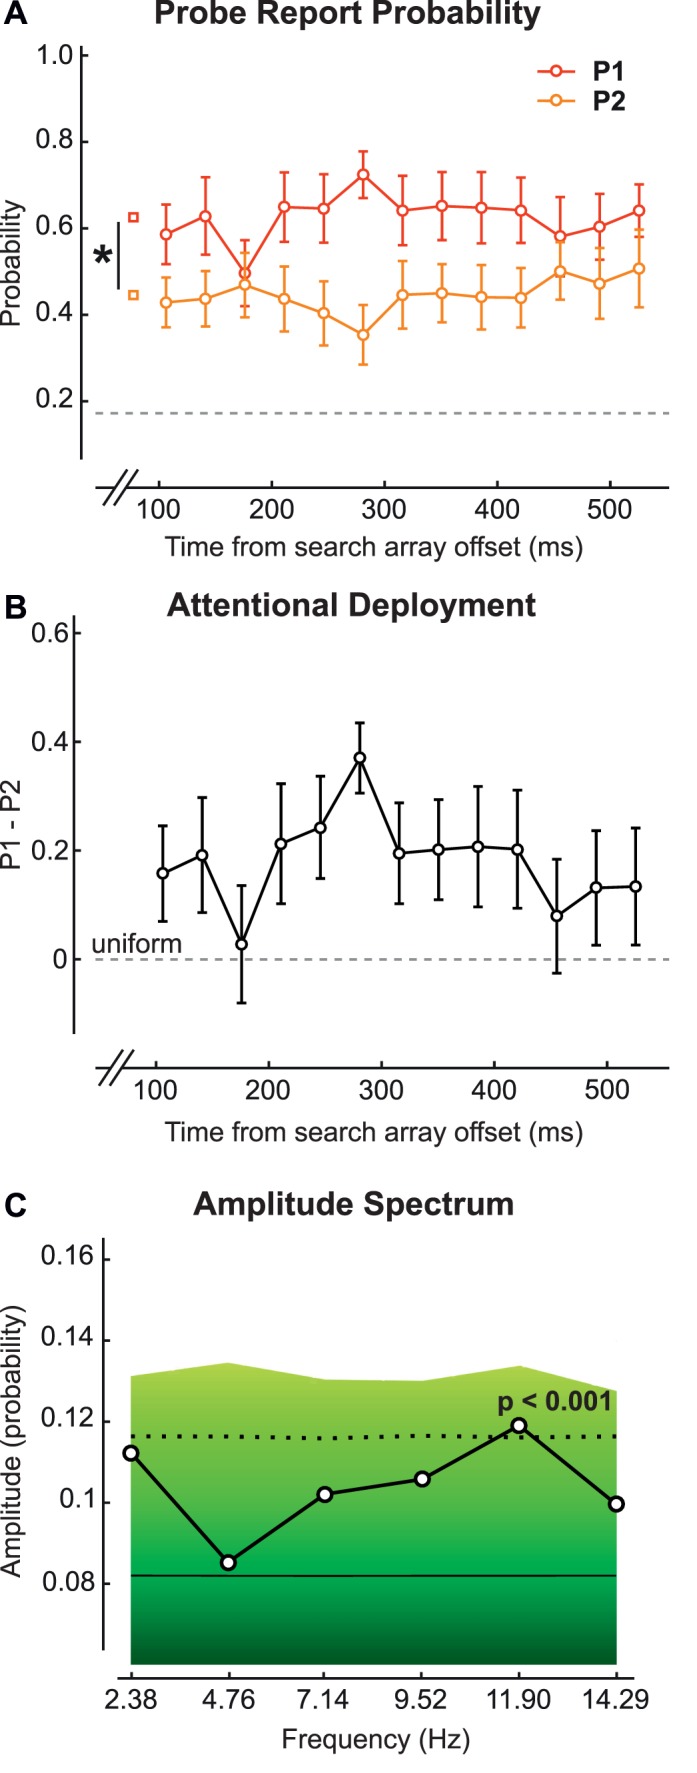
Figure 5.

(A) P1 and P2 for the feature condition of the main experiment. (B) The difference of P1 and P2. (C) The amplitude spectrum obtained from the average of fast Fourier transforms on individual differences of P1 and P2 for each observer. The background colors indicate a bootstrap statistical test. The solid black line represents the average amplitude spectrum for the bootstrapped values. The dotted black line represents the boundary for p = 0.001.
