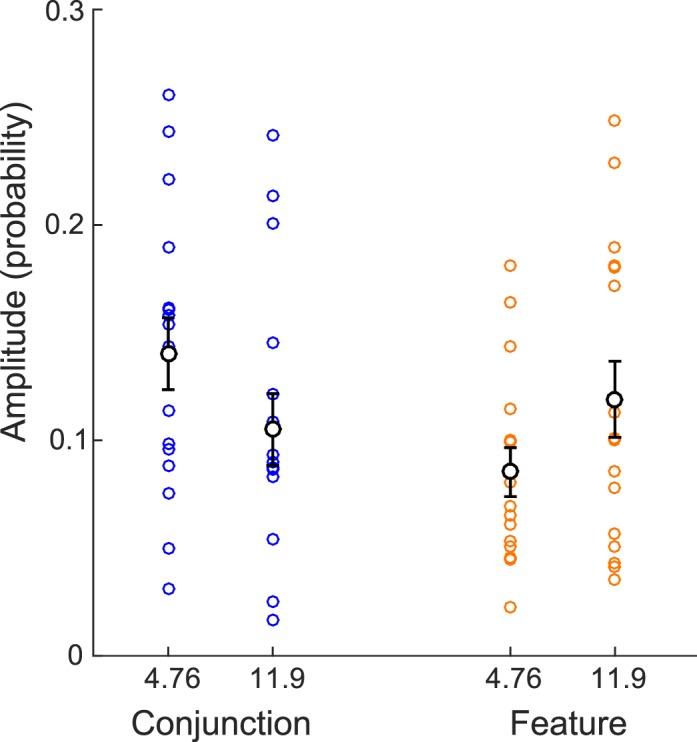
Figure 6.

Amplitudes of the 4.76- and 11.9-Hz components, obtained from the average of fast Fourier transforms on individual differences of P1 and P2, compared for the conjunction and feature conditions. The data for each observer are represented with colored dots. The mean and standard error of the mean are represented in black.
