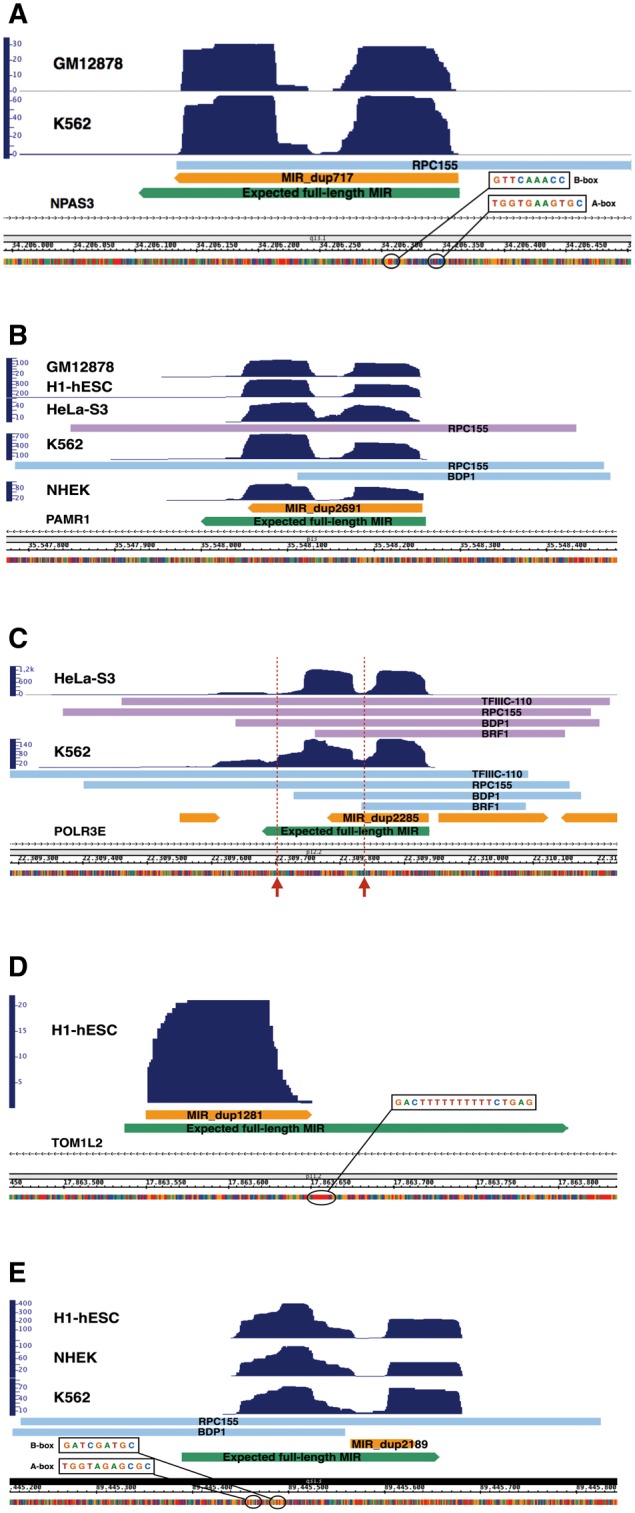
Figure 3.

Base-resolution expression profiles for five representative MIRs. See text for descriptions. Bars labeled with the names of Pol III transcription components (RPC155, TFIIIC110, BDP1, BRF1) indicate regions of enrichment of the corresponding proteins according to publicly available ChIP-seq data; upper arrowed bars represent the annotated MIR elements while the lower arrowed bars represent the corresponding expected full-length MIR elements which does not correspond to annotated elements and are reported merely to locate the alignment position of the annotated MIRs within the corresponding consensus sequence. Arrows in panel C point to the positions of strong Pol III terminators. (A) MIR_dup717 chr14:34206132-34206363; (B) MIR_dup2691 chr11:35548054-35548257 which resides within an intron of the PAMR1 gene in sense orientation; (C) MIR_dup2285 chr16:22309780-22309939; (D) MIRb_dup1281 chr17:17863550-17863651; (E) MIRc_dup2189 chr14:89445565-89445634
