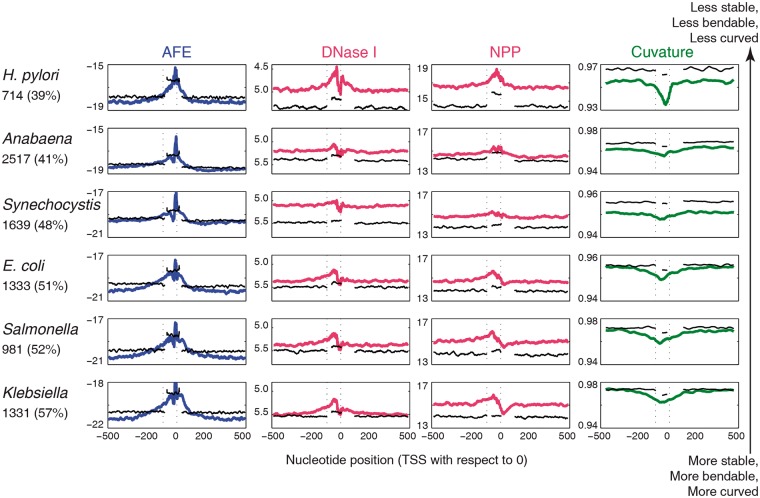
Figure 1.
DNA sequence dependent structural properties: AFE, DNase I sensitivity, NPP and curvature profiles for 1001 nucleotides long primary (gTSS) promoter sequences (extending from −500 to + 500 nucleotides with respect to TSS at 0). The black colour plots correspond to profiles of structural feature for shuffled sequences (upstream −500 to − 100, promoter region −80 to + 20 and downstream +100 to + 500 nucleotide position with respect to TSS at 0). The number of promoter sequences and whole genome GC% is mentioned along with the organism name, on the left of each row.

