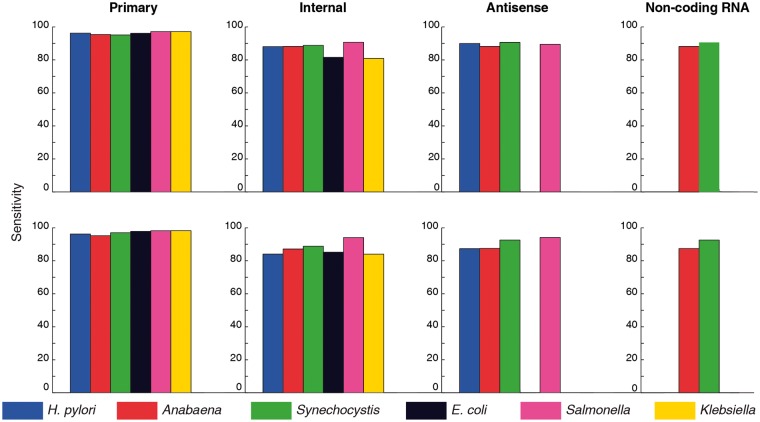
Figure 4.
Bar plots showing sensitivity values obtained from cycle I predictions, using one or more structural features for different categories of TSSs. Top row correspond to stability, bendability using DNase I sensitivity and curvature while bottom row corresponds to stability, bendability using NPP and curvature.

