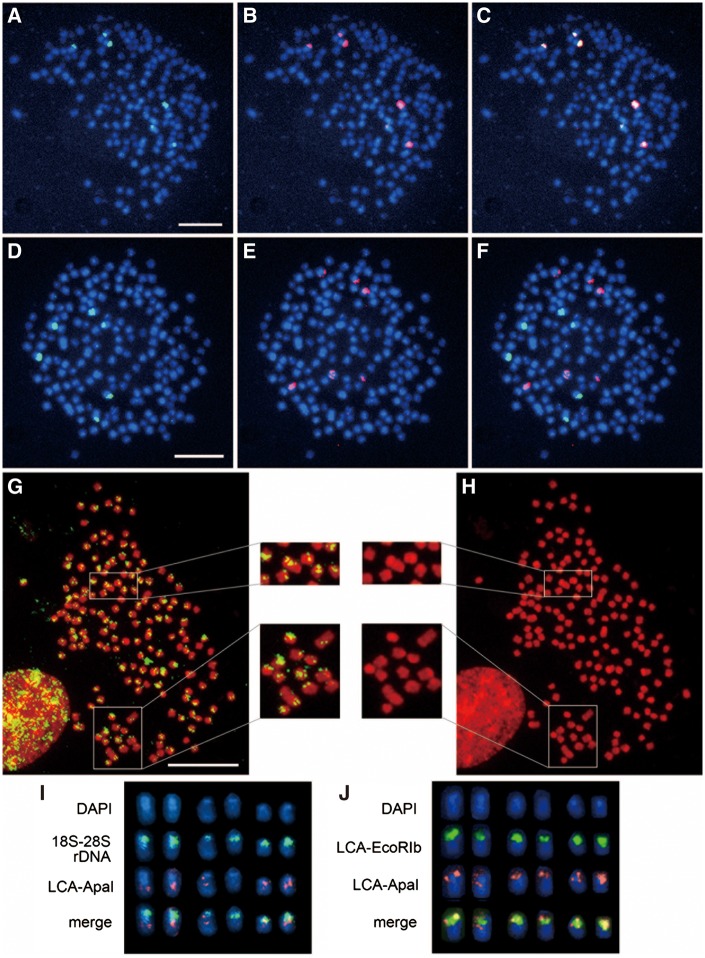
Figure 4.
Chromosomal distribution of the LCA-EcoRI and LCA-ApaI sequences. (A) DAPI-stained metaphase spread hybridized with biotin-labeled LCA-EcoRIa (green). (B) The same metaphase spread in (A) hybridized with a DIG-labeled 18S–28S rRNA gene probe (red). (C) Merged image of the signals for biotin-labeled LCA-EcoRIa and DIG-labeled 18S–28S rDNA. (D–F) Hybridization patterns of biotin-labeled LCA-EcoRIb (green) (D) and DIG-labeled 18S–28S rDNA (red) (E) on the same DAPI-stained metaphase spread and their merge (F). (G, H) Hybridization patterns of biotin-labeled LCA-ApaI (green) on a PI-stained metaphase spread (G) and the PI-stained metaphase spread (H). Enlarged photographs of chromosomes hybridized to the LCA-ApaI probe in two parts of the metaphase spread are shown. Squares with white outlines on the metaphase spreads indicate the magnified areas. (I) Comparison of the hybridization patterns of biotin-labeled 18S–28S rDNA (green) and DIG-labeled LCA-ApaI (red) on six DAPI-stained chromosomes. (J) Comparison of the chromosome distribution patterns of biotin-labeled LCA-EcoRIb (green) and DIG-labeled LCA-ApaI (red). In the merged images (I, J), the regions of overlap between the two probes are shown in yellow. Scale bars represent 10 µm. LCA-EcoRIb 4 (LC149803) and LCA-ApaI 1 (LC149811) fragments were used as probes.

