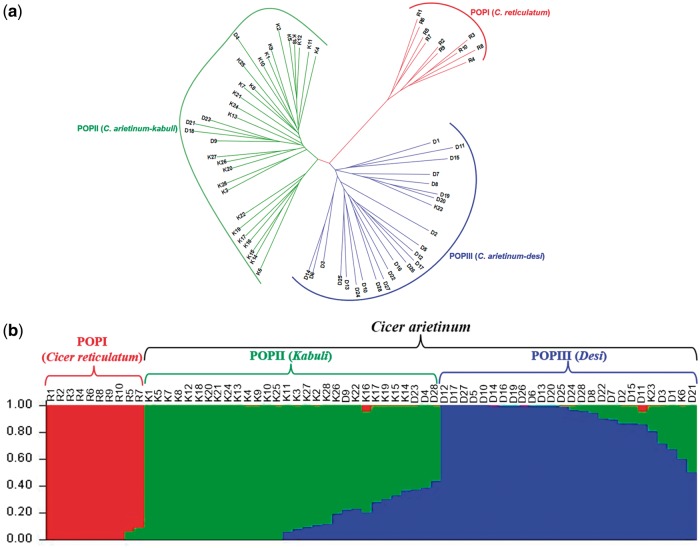
Figure 4.
Genome-wide SNP-based molecular diversity among 66 wild and domesticated chickpea accessions. (a) Unrooted phylogram depicting the genetic relationships (Nei’s genetic distance) among 66 wild (R1-10), desi (D1-28) and kabuli (K1-28) chickpea accessions based on genome-wide SNP mapped on C. reticulatum genome assembly. The phylogenetic tree differentiated 66 accessions into three diverse groups. (b) The population genetic structure of the wild and domesticated chickpea accessions. The mapped genetic markers assigned to three distinct desi, kabuli and wild population groups at population number (K = 3). The accessions represented by vertical bars along the horizontal axis were classified into K colour segments based on their estimated membership fraction in each K cluster. The colour version of the figure is available online.

