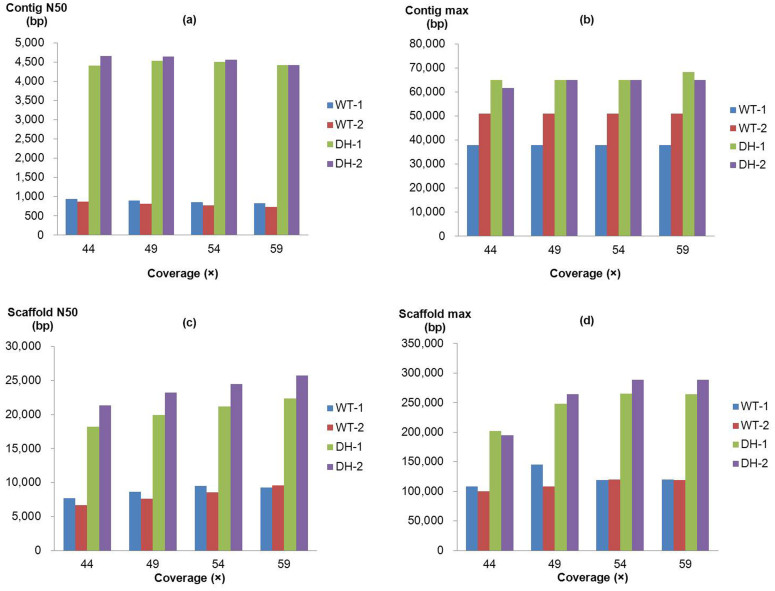
Figure 1. Comparison of assembly performance for wildtype and doubled-haploid genomes.
The sizes of (a) contig N50, (b) contig max, (c) scaffold N50, and (d) scaffold max, including sizes of four individuals (WT-1, WT-2, DH-1, and DH-2) with different data coverage (44×, 49×, 54×, and 59×) are shown.

