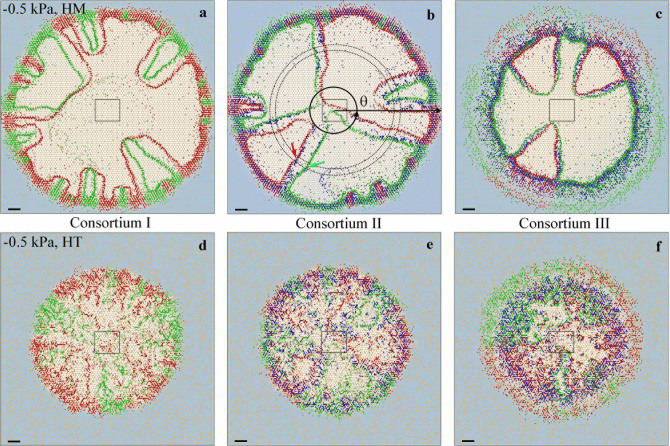
Figure 1. Simulated microbial spatial patterns on rough surfaces of different consortium types.
Simulated microbial spatial patterns of consortium I (a, d), consortium II (b, e), and consortium III (c, f) on homogeneous (HM) and heterogeneous (HT) hydrated rough surfaces at −0.5 kPa at 50 h after inoculation. Red, green and blue spots represent individual cells of sp1, sp2 and sp3, respectively. Light blue background marks normalized concentration of N1 (white area means N1 was depleted). Squares mark original inoculation positions; a definition of θ is for angular distributions of microbial populations and associating nutrient concentrations in Fig. 3, with the dash-circles mark the target region for analyses; red and green arrows mark the persisting population bands of sp1 and sp2. The scale bar is 1 mm.

